No Comments

Buying a Brand new home in Ottawa – Questions you should ask: Sept 2023

Buying a Brand new home Q and A.

Questions you should ask before Buying a Brand new home in Ottawa: Sept 2023


Builder Agreements should include details such as:

PDI – Date

Assignment clause: a must

Evaluation of home value (Appraisal – you should pay for one)

Deposit Structure: Can you get a better deposit structure

Mortgage approval – a must

Pre-approval – a must

Insurance clause – a must


Location:

Flooding topography

Hwy access

Hydro box green

Road T

SITE PLAN disclosure – commercial or other future development, check with the city

Backing on to graveyards or other

WHAT FUTURE DEVELOPMENT WILL HAPPEN AROUND THE HOME is very import to value

Shopping close

Schools

Bus stops


Structure:

Model

Sqft cost

List of actual finishes

Design

Floor plan

How long is your Tarion Warranty, and what is under warranty and for how long?

Upgrades list and value $

Builder Insurance coverage


(* for information only  – buyers need legal advice or to work with an agent)


Ottawa homes for sale

Kanata Homes for sale

Orleans homes for sale

Barrhaven homes for sale


No Comments

OTTAWA REAL ESTATE MARKET UPDATE – SEPT 20TH 2023 – HOMES FOR SALE IN OTTAWA -HOMES FOR SALE IN KANATA – HOME PRICES IN OTTAWA

September 20th, 2023

The average sale price for a freehold-class property in August 2023 was $709,739

Ottawa Resale Market Stalls in August, Supply Challenges Persist!

Low inventory, not enough listings.

Source: OREB

The Ottawa Real Estate Board reported that its members  sold 1,196 residential properties in August through the Board’s Multiple Listing Service® (MLS®) System data service, compared with 1,130 in August 2022, an increase of 6%. August’s sales included 903 in the freehold-property class, up 7% from a year ago, and 293 in the condominium-property category, a 2% increase from August 2022. The five-year average for total unit sales in August is 1,525.

Call today for free one-on-one market update on Buying or Selling a home.

“Ottawa Sales activity was up marginally on a year-over-year basis in August but remained well below the historical average for this time of year,” says Ken Dekker, OREB President. “There is no shortage of demand given increased immigration and the large Canadian population cohort entering the market. The lack of suitable, affordable housing is a hindrance. High borrowing costs and economic uncertainty are impacting both sellers and buyers, which we expect will continue to result in further market fluctuations.”


Ottawa Real Estate Average Prices*:

  • The average sale price for a freehold-class property in August was $709,739, an increase of 0.5% from 2022, and a 5.6% decrease over July 2023 prices.
  • The average sale price for a condominium-class property was $425,968 an increase of 1% from a year ago, although 1.4% lower than July 2023 prices.
  • With year-to-date average sale prices at $732,220 for freeholds and $432,571 for condos, these values represent an 8% decrease over 2022 for freehold-class properties and a 5.5% decrease for condominium-class properties.


Thank you for your trust!

Selling and Buying a home made easy!


Price changes: September  2023 report

Number of Sold properties by week. vs other years   2023 report

NUMBER OF HOME FOR SALE ARE LOWER THAN OTHER YEARS


AVERAGE SALE Price Changes: SEPT 2023 report

IT LOOKS LIKE 2022 AND 2023 HAVE THE SAME AVERAGE SALE PRICE


RESIDENTIAL Price Changes: September  2023 report

LOW NUMBER OF LISTINGS, LOW SALE VOLUME 2023


NEW LISTINGS are down this week – this means low inventory : SEPT 2023 report

IT LOOKS LIKE WE ARE STILL LOW ON LISTINGS


PRICES ARE MORE AFFORDABLE NOW AND MAY MOVING BACK UP IF INVENTORY STAYS LOW, ACCORDING TO THE OTTAWA REAL ESTATE BOARD, SEPT 2023 REPORT.


No Comments

OTTAWA REAL ESTATE MARKET UPDATE – MAY 2023 – HOMES FOR SALE IN OTTAWA -HOMES FOR SALE IN KANATA – HOME PRICES IN OTTAWA

MAY 3, 2023

Resale Market Springs Back in Favour of Sellers

Average prices have increased by 13.9% in four months!

Low inventory, not enough listings.

Source: OREB

May 2023, Ottawa Real estate Market update.

NUMBERS SOLD: The members Ottawa Real Estate Board (OREB) sold 1,488 residential properties in April through the Board’s Multiple Listing Service® (MLS®) System, compared with 1,876 in April 2022, a decrease of 21%.

SALES NUMBERS DOWN: Sales included 1,156 in the freehold-property class, down 18% from a year ago, and 332 in the condominium-property category, a decrease of 29% from April 2022. The five-year average for total unit sales in April is 1,739.

RESALE UPWARD TREND: “Ottawa’s resale market is on a steady upward trajectory, narrowing the comparison gap to peak pandemic activity in 2022.

LOW INVENTORY – NOT ENOUGH NEW LISTINGS: New listings not keeping pace, the available housing stock is declining, and with less than two months of inventory — “we’re back into seller’s market territory,” says Ottawa Real Estate Board President Ken Dekker.

By the Numbers – Average Prices*:

  • Average prices have increased by 13.9% in four months since the market low in December 2022.

  • The average sale price for a freehold-class property in April 2023 was $747,123, a decrease of 10% from 2022. However, it marks a 5% increase over March 2023.
  • The average sale price for a condominium-class property was $435,875, decreasing 8% from a year ago, but still a 4% gain over March 2023.
  • With year-to-date average sale prices at $718,633 for freeholds and $421,722 for condos, these values represent a 13% decrease over 2022 for freehold-class properties and a 10% decrease for condominium-class properties.

Upward pressure on sales prices continues with average prices increasing for the fourth month since the market low in December.

MULTIPLE OFFERS: Additionally, multiple offer situations have returned to certain neighbourhoods and overall days on market are maintaining their downward trend. There continues to be low inventory in certain property classes and new product is coming to the market at a slower rate, which is affecting supply.”

By the Numbers – Inventory & New Listings:

  • April’s new listings (2,144) were 25% lower than April 2022 (2,843) and up 3% from March 2023 (2,089). The 5-year average for new listings in April is 2,575.
  • Months of Inventory for the freehold-class properties has increased to 1.9 months from 0.9 months in April 2022 but down from 2.3 months in March.
  • Months of Inventory for condominium-class properties has increased to 1.9 months from 0.8 months in April 2022, although down from 2.1 months in March.
  • Days on market (DOM) for freeholds decreased from 34 to 27 days and 39 to 33 days for condos compared to last month.

“These numbers are static, snapshots in time. REALTORS® can give buyers and sellers a fulsome day-to-day picture of how the market is shifting and heating up this season. They have their fingers on the pulse of each neighbourhood in the city and can help buyers and sellers make localized, strategic, data-informed decisions.”

REALTORS® also help with finding rentals and vetting potential tenants. Since the beginning of the year, OREB Members have assisted clients with renting 2,151 properties compared to 1,786 last year at this time, an increase of 20%.

* OREB cautions that the average sale price can be useful in establishing trends over time but should not be used as an indicator that specific properties have increased or decreased in value. The calculation of the average sale price is based on the total dollar volume of all properties sold. Price will vary from neighbourhood to neighbourhood.

Call today for free one-on-one market update on Buying or Selling a home.


Thank you for your trust!

Selling and Buying a home made easy!


Price changes: May 2023 report


Price Range Sales volume: May 2023 report


CONDOS Price Changes: May 2023 report


RESIDENTIAL Price Changes: May 2023 report


NEW LISTINGS are down this week – this means low inventory : May 2023 report

When inventory is low, prices go up. Look at the light blue line, slowly moving upwards, as we get more listings on the MLS market, but not as 2022 volume.

660 listed properties this week, compared to 2022 of 800-1000 listings range.

Low supply means only one thing…prices go up!


RESIDENTIAL AND CONDO Price Changes: May 2023 report

Look at the light blue line, slowly moving upwards in Sale Prices.


PRICES ARE MOVING BACK UP ACCORDING TO THE OTTAWA REAL ESTATE BOARD, MAY 2023 REPORT.



THESE ARE SOME OF THE 

MORTGAGE RATE I’M SEEING, MAY 2023 REPORT.


No Comments

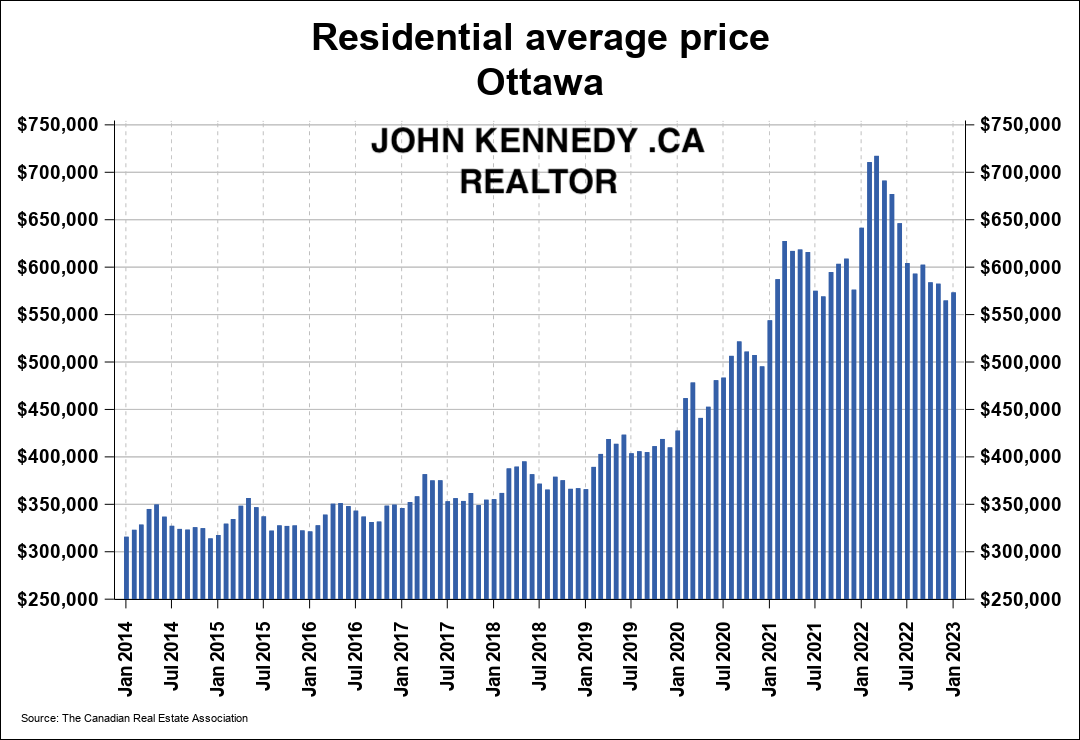
Residential in Ottawa Real Estate shows -15% Down from last year Average price – Ottawa Homes for Sale – Kanata homes for sale – Barrhaven homes for sale

Residential in Ottawa Real Estate shows -15% Down from last year Average price – However, it marks a 5% increase over January 2023.

Resale Market Stabilizes in February with a Glimmer of Hope for Buyers and Sellers Alike!

OREB NEWS

March 3, 2023

Members of the Ottawa Real Estate Board (OREB) sold 855 residential properties in February through the Board’s Multiple Listing Service® (MLS®) System, compared with 1,411 in February 2022, a decrease of 39%. February’s sales included 633 in the freehold-property class, down 42% from a year ago, and 222 in the condominium-property category, a decrease of 31% from February 2022. The five-year average for total unit sales in February is 1,157.

“We’re going to see declines in transactions and prices when we compare current figures to last February — the height of the pandemic resale market activity,” says Ottawa Real Estate Board’s President Ken Dekker. “On the other hand, with the Bank of Canada holding interest rates steady, prospective buyers have more budget certainty to work with as we head into the spring market.”

By the Numbers – Average Prices*:

  • The average sale price for a freehold-class property in February was $708,968, a decrease of 15% from 2022. However, it marks a 5% increase over January 2023.
  • The average sale price for a condominium-class property was $410,927, decreasing 12% from a year ago.
  • With year-to-date average sale prices at $695,086 for freeholds and $411,449 for condos, these values represent a 14% decrease over 2022 for freehold-class properties and a 10% decrease for condominium-class properties.

“The average price increase for freeholds over January could be an indicator that buyers have normalized to the current interest rates. And perhaps, it’s a glimmer of more activity to come in the months ahead.”

By the Numbers – Inventory & New Listings:

  • Months of Inventory for the freehold-class properties has increased to 2.8 months from 0.7 months in February 2022.
  • Months of Inventory for condominium-class properties has increased to 2.5 months from 0.7 months in February 2022.
  • February’s new listings (1,366) were 22% lower than February 2022 (1,762) and up 3% from January 2023 (1,323). The 5-year average for new listings in February is 1,632.
  • Days on market (DOM) for freeholds decreased from 43 to 37 days and 47 to 43 days for condos compared to last month.

“A decrease in the days on market, paired with fewer new listings entering the market, is good news for sellers,” says Dekker. “However, if that trend continues to impact our supply stock and we don’t get more inventory, our otherwise balanced market could swing back into seller’s territory — but it’s too early to predict.”

“The best advice for sellers and buyers in today’s market is to pay close attention to the comparison and competition insights only a REALTOR® can offer. Ottawa is made up of many micro-markets, and neighbourhood-level data is vital to standing out and closing deals.”

REALTORS® also help with finding rentals and vetting potential tenants. Since the beginning of the year, OREB Members have assisted clients with renting 995 properties compared to 800 last year at this time, an increase of 24%.


Details:

Average Sale Price February 2023= from $708,172 down to $620,088 (-12.4% down)

Quantity of sales: 2471 down to 1513 in Feb 2023 (-38% down)

CDOM= Re-listed : Days on Market from 27 to 69 days ( more days on market:  +42 days)

DOM= Days on Market – from 19 days TO 44 days longer in 2023 ( more days on market:  +25 days)


Verified by MonsterInsights