Tag: BRIDLEWOOD HOME PRICE
Invalid Listing ID
HOMES FOR SALE IN KANATA TODAY
Kanata Real Estate market news – Feb 23 2021 – Kanata homes for Sale – Latest News in Kanata Real Estate – KANATA HOMES FOR SALE
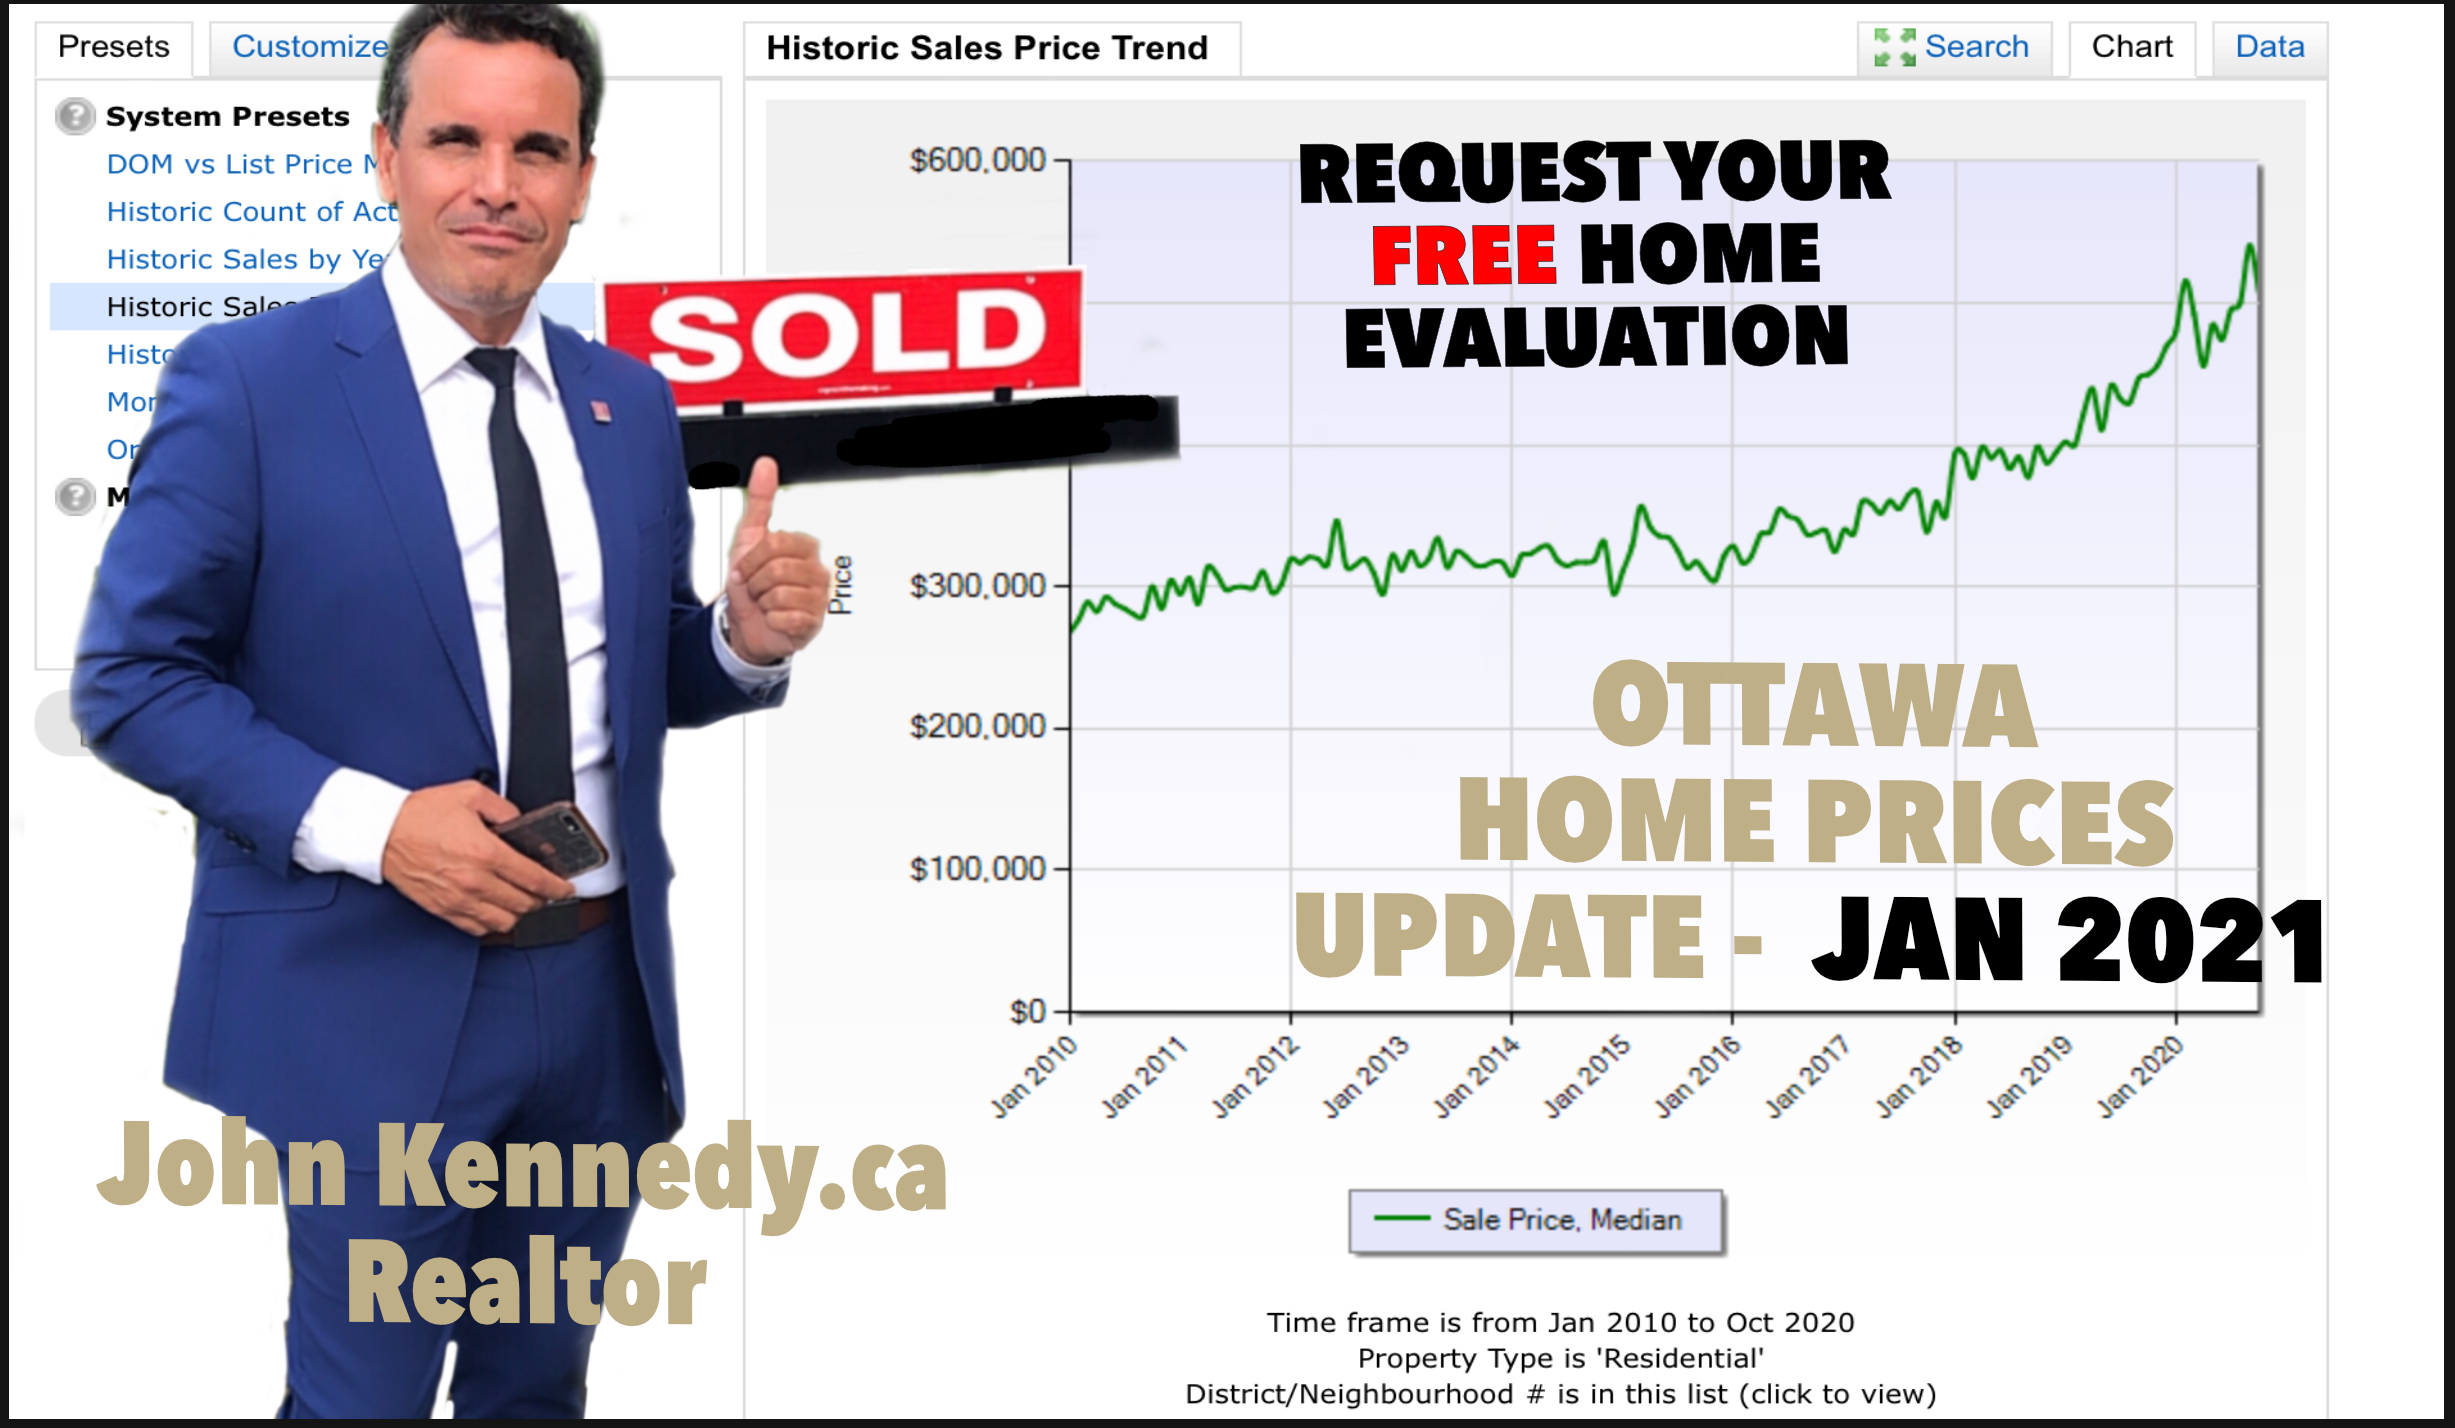
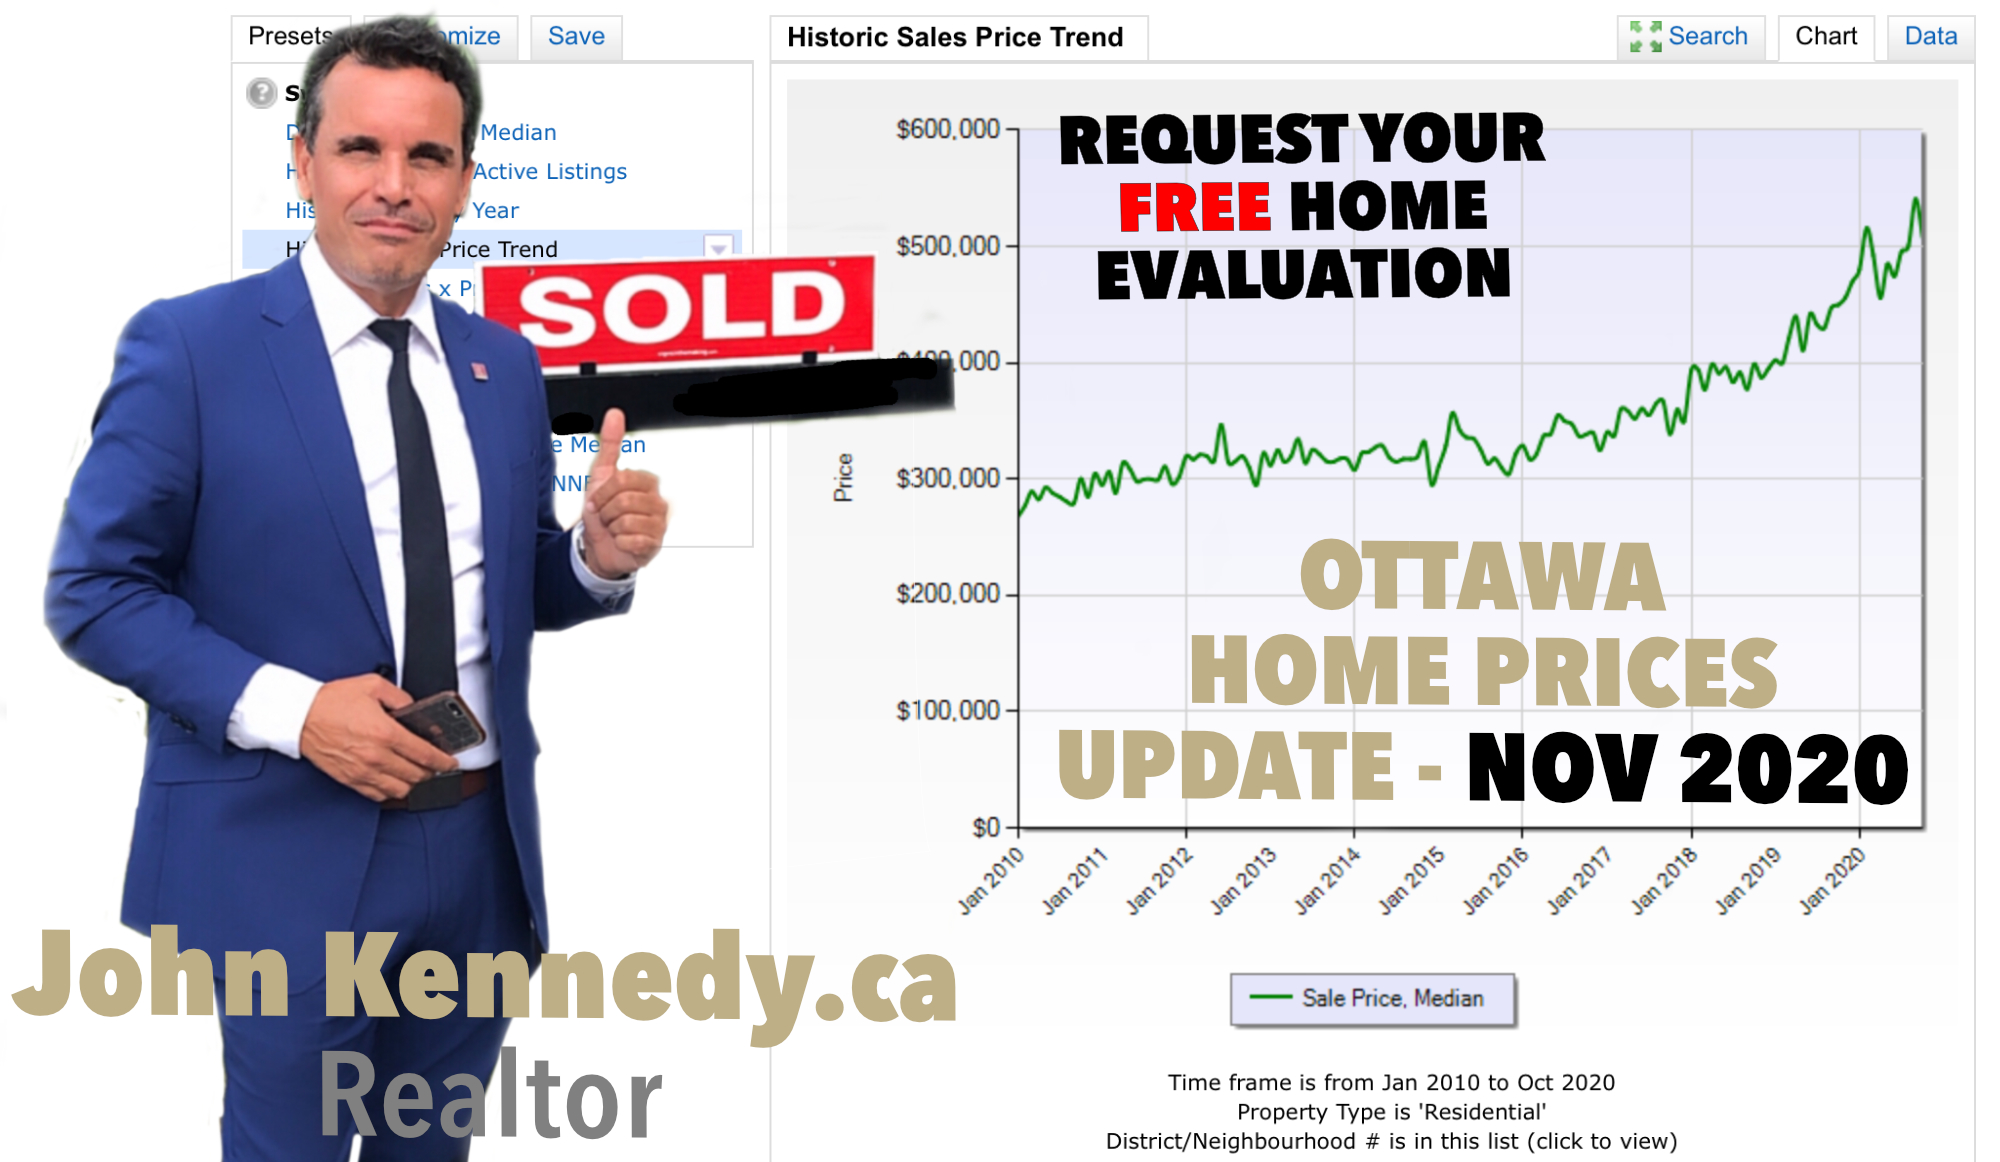
Prices in Residential went up +31.2% from last January 2020 to January 2021…get the answers from me. Guidance Selling and Buying Real Estate.
Source: Our Ottawa Real Estate board
REPORT: Feb 16 2021
Average Prices and Changes
All Real estate types of properties in Kanata and Ottawa’s. See this next chart on what’s happening to Residential vs other types.
Price ranges and changes
We still have low inventory – it’s a great time to sell

My information and research is based on the CREA and OREB stats and charts for this month.
Pent-up Buyer Demand Drives January’s 2021 Resale Market!
OTTAWA, February 3, 2021 – Members of the Ottawa Real Estate Board sold 964 residential properties in January through the Board’s Multiple Listing Service® System, compared with 778 in January 2020, an increase of 24 per cent. January’s sales included 674 in the residential-property class, up 21 per cent from a year ago, and 290 in the condominium-property category, an increase of 31 per cent from January 2020. The five-year average for total unit sales in January is 786.
“Pent-up Buyer demand fueled the exceptional number of sales that took place in January even as the mid-month lockdown further restricted supply. Earlier in the month, listing activity increased, likely driven by those Sellers waiting until after the holiday season to put their properties on the market.
However, once the Stay-at-Home Order was announced, Sellers pulled back (rightfully so) and the number of properties entering the market declined,” states Ottawa Real Estate Board President Debra Wright.
“Even though inventory is up from last month, it is still down substantially from last year at this time with 43% fewer properties on the market. This inventory shortage coupled with strong demand triggered a brisk pace to the market. We would have certainly seen higher sales numbers if there were more properties available because the demand is definitely there.”
January’s average sale price for a condominium-class property was $380,336, an increase of 13 per cent from last year, while the average sale price of a residential-class property was $677,197, an increase of 31 per cent from a year ago. Compared to December, the average price for residential-class properties has increased by 12 per cent, and the average price for condominium-class units is 7 per cent higher.* range, while last year at this time, there were only 16 transactions. Sustained price movements are better reflected during the mid to latter part of the year, where trends begin to emerge, and comparisons can be drawn,” advises Wright. “This leads me into my next point – market activity has curtailed, there is no question about that, with January resale numbers lower than what we saw in December. But the effects of this second lockdown will not be entirely measurable until the coming months, dependent on when the mandated Stay- at-Home Order is retracted. If the lockdown is extended, that could affect the market in the longer term; however, as we saw last year, the market was resilient throughout and is being driven by the needs of Buyers and Sellers,” Wright concludes.
In addition to residential sales, OREB Members assisted clients with renting 333 properties in January 2021 compared with 243 in January 2020.
* The Board cautions that the average sale price can be useful in establishing trends over time but should not be used as an indicator that specific properties have increased or decreased in value. The calculation of the average sale price is based on the total dollar volume of all properties sold. Price and conditions will vary from neighbourhood to neighbourhood. “I would like to caution those looking at the increase in average prices this month and believing that property values are accelerating at an extreme pace. In January, there was considerable movement in the upper end of the market, which caused a bit of an anomalous outcome in average price percentages. For example, there were 63 sales in the $1M+ price
HOMES FOR SALE IN KANATA TODAY
Invalid Listing ID
74 WATERTON CRES, Kanata K2M 1Z2
CREA DDF® Data
Kanata Real Estate market news – Feb 16th 2021 – Kanata homes for Sale – Latest News in Kanata Real Estate – KANATA HOMES FOR SALE
Prices in Residential went up +31.2% from last January 2020 to January 2021…get the answers from me. Guidance Selling and Buying Real Estate.
Source: Our Ottawa Real Estate board
REPORT: Feb 16 2021
Average Prices and Changes
All Real estate types of properties in Kanata and Ottawa’s. See this next chart on what’s happening to Residential vs other types.
Price rages and changes
We still have low inventory – it’s a great time to sell

My information and research is based on the CREA and OREB stats and charts for this month.
Pent-up Buyer Demand Drives January’s 2021 Resale Market!
OTTAWA, February 3, 2021 – Members of the Ottawa Real Estate Board sold 964 residential properties in January through the Board’s Multiple Listing Service® System, compared with 778 in January 2020, an increase of 24 per cent. January’s sales included 674 in the residential-property class, up 21 per cent from a year ago, and 290 in the condominium-property category, an increase of 31 per cent from January 2020. The five-year average for total unit sales in January is 786.
“Pent-up Buyer demand fueled the exceptional number of sales that took place in January even as the mid-month lockdown further restricted supply. Earlier in the month, listing activity increased, likely driven by those Sellers waiting until after the holiday season to put their properties on the market.
However, once the Stay-at-Home Order was announced, Sellers pulled back (rightfully so) and the number of properties entering the market declined,” states Ottawa Real Estate Board President Debra Wright.
“Even though inventory is up from last month, it is still down substantially from last year at this time with 43% fewer properties on the market. This inventory shortage coupled with strong demand triggered a brisk pace to the market. We would have certainly seen higher sales numbers if there were more properties available because the demand is definitely there.”
January’s average sale price for a condominium-class property was $380,336, an increase of 13 per cent from last year, while the average sale price of a residential-class property was $677,197, an increase of 31 per cent from a year ago. Compared to December, the average price for residential-class properties has increased by 12 per cent, and the average price for condominium-class units is 7 per cent higher.* range, while last year at this time, there were only 16 transactions. Sustained price movements are better reflected during the mid to latter part of the year, where trends begin to emerge, and comparisons can be drawn,” advises Wright. “This leads me into my next point – market activity has curtailed, there is no question about that, with January resale numbers lower than what we saw in December. But the effects of this second lockdown will not be entirely measurable until the coming months, dependent on when the mandated Stay- at-Home Order is retracted. If the lockdown is extended, that could affect the market in the longer term; however, as we saw last year, the market was resilient throughout and is being driven by the needs of Buyers and Sellers,” Wright concludes.
In addition to residential sales, OREB Members assisted clients with renting 333 properties in January 2021 compared with 243 in January 2020.
* The Board cautions that the average sale price can be useful in establishing trends over time but should not be used as an indicator that specific properties have increased or decreased in value. The calculation of the average sale price is based on the total dollar volume of all properties sold. Price and conditions will vary from neighbourhood to neighbourhood. “I would like to caution those looking at the increase in average prices this month and believing that property values are accelerating at an extreme pace. In January, there was considerable movement in the upper end of the market, which caused a bit of an anomalous outcome in average price percentages. For example, there were 63 sales in the $1M+ price
Kanata Homes for Sale – Ottawa Home prices –
Listen to our full market video report for January 26th 2021 – Kanata Home Prices – Ottawa Home prices update.
VIDEO
HOMES FOR SALE IN KANATA
HOMES FOR SALE IN OTTAWA
RECEIVE THESE POST IN YOUR EMAIL
OTTAWA – KANATA – REAL ESTATE UPDATES, PRICES SOLD, AVERAGE PRICE ON YOUR STREET, AND LOTS MORE
JOIN MY NEWSLETTER
and
FACEBOOK PAGE
KANATA HOMES FOR SALE
KANATA HOME PRICES
KANATA HOME REPORTS
KANATA HOME PRICES FOR 2021
KANATA TOWNHOMES
KANATA DETACHED HOMES PRICES
KANATA REAL ESTATE MARKET PRICES
2021 KANATA HOME PRICES
OTTAWA HOMES FOR SALE
OTTAWA HOME PRICES
OTTAWA HOME REPORTS
OTTAWA HOME PRICES FOR 2021
OTTAWA TOWNHOMES
OTTAWA DETACHED HOMES PRICES
OTTAWA REAL ESTATE MARKET PRICES
2021 OTTAWA HOME PRICES
Kanata Homes for Sale, listen to our full market report for January 26th 2021 – Kanata Home Prices
HOMES FOR SALE IN KANATA
HOMES FOR SALE IN OTTAWA
KANATA HOMES FOR SALE
KANATA HOME PRICES
KANATA HOME REPORTS
KANATA HOME PRICES FOR 2021
KANATA TOWNHOMES
KANATA DETACHED HOMES PRICES
KANATA REAL ESTATE MARKET PRICES
2021 KANAT HOME PRICES
KANATA and OTTAWA REAL ESTATE UPDATE 25 JAN 2021
Theses are the sold prices for 4 bedrooms DETACHED HOMES in all Ottawa. Average price shows $736,324. As you can see it’s still selling over the asking price a bit, and is based on the last 160 homes sold in Dec 2020.
DETACHED HOMES
Theses are the sold prices for 3 bedrooms DETACHED HOMES in all Ottawa. Average price shows $521,326. As you can see it’s still selling over the asking price and is based on the last 335 homes sold in Dec 2020
DETACHED HOMES

Theses are the sold prices for 3 bedrooms TOWN HOMES in all Ottawa. Average price shows $534,107. As you can see it’s still selling over the asking price and is based on the last 181 homes sold in Dec 2020
TOWNHOMES SOLD PRICES, not in condo property management.
Theses are the sold prices for 3 bedrooms TOWN HOMES with Condominium management in all Ottawa. Average price shows $344,665. As you can see it’s still selling over the asking price and is based on the last 81 homes sold in Dec 2020
TOWNHOMES SOLD PRICES, WITH CONDOMINIUM property management
Source : Ottawa Real Estate Board.
HOMES FOR SALE IN KANATA
HOMES FOR SALE IN OTTAWA
Ottawa’s Resale Market “Steady as She Goes”
OTTAWA REAL ESTATE NEWS- Here are my reviews of current market values.

Ottawa’s REAL ESTATE Resale Market News and updates Nov 24th 2020
OTTAWA, November 4, 2020 – Members of the Ottawa Real Estate Board sold 2,146 residential properties in October through the Board’s Multiple Listing Service® System, compared with 1,604 in October 2019, a year over year increase of 34 per cent. October’s sales included 1,665 in the residential- property class, up 38 per cent from a year ago, and 481 in the condominium- property category, an increase of 22 per cent from October 2019. The five-year average for October unit sales is 1,515.
“We are heading into the colder months, the second wave of the pandemic is upon us, and yet Ottawa’s resale market continues to hold steady,” observes Ottawa Real Estate Board President Deb Burgoyne.
“While the October average price gains, number of sales, and new listings coming onto the market were all down from September, demand persists, and the number of sellers choosing to enter the market remains strong. With 1,937 residential listings and 708 condo units added to the housing stock in October, this is a 48% and 70% respective increase in new listings over last year at this time,” she adds.
October’s average sale price for a condominium-class property was $368,936, an increase of 16 per cent from this time last year, while the average sale price of a residential-class property was $603,253, an increase of 25 percent from a year ago. With year- to-date average sale prices at $579,026 for residential and $361,666 for condominiums, these values represent a 19 per cent percent increase over 2019 for both property classes.*
“The condominium market is on our watchlist. Inventory for condo units increased 15% over last October, while inventory for residential properties is down 46%. This is an inverse relationship compared to the beginning of 2020 when condo supply was depleting much quicker than residential,” reports Burgoyne.“The shift in the condo market occurred around June. There has been a lot of speculation about changing buyer behaviour and preferences due to our pandemic reality with homeowners wanting home offices and gym space, for example. One could extrapolate or conclude that buying preferences may be shifting towards a desire for properties with more square footage than this property type offers. Particularly, due to the sheer number of employees working remotely for the foreseeable future, commute times may continue to be less of an issue.”
“As the chillier weather and upcoming holiday season approaches, it will be interesting to see how the market calibrates. Typically, we start to see a slowdown in home sale activity. Whether that actually transpires is something we can’t predict given the topsy turvy year that is 2020. What I can tell you is that this is not the time to navigate the market on your own; there is too much at stake to venture in without the knowledge and guidance of an experienced REALTOR®,” Burgoyne concludes.
In addition to residential and condominium sales, OREB Members assisted clients with renting 2,829 properties since the beginning of the year compared to 2,334 at this time last year. * The Board cautions that the average sale price can be useful in establishing trends over time but should not be used as an indicator that specific properties have increased or decreased in value. The calculation of the average sale price is based on the total dollar volume of all properties sold. Price and conditions will vary from neighbourhood to neighbourhood.
Source:
The Ottawa Real Estate Board
FREE HOME EVALUATION 24 NOV 2020
KANATA HOMES FOR SALE
KANATA REAL ESTATE 24 NOV 2020
KANATA HOME PRICING 24 NOV 2020
KANATA NOV 2020 SALE PRICES 24 NOV 2020
KANATA REAL ESTATE AGENT 24 NOV 2020
KANATA HOME NEWS ,24 NOV 2020
KANATA BRIDLEWOOD HOME PRICES 24 NOV 2020
KANATA BRIDLEWOOD HOMES FOR SALE 24 NOV 2020
KANATA MLS – KANATA STREET SOLD PRICES 24 NOV 2020
KANATA HOMES AVERAGE PRICES UPDATE NOV 17 2020
——————————
JUST SOLD HOME PRICES IN BRIDLEWOOD KANATA – AVERAGE PRICES OF HOMES FOR NOV 17, 2020
KANATA HOMES FOR SALE -KANATA HOME NEWS – KANATA HOME PRICES NEWS – KANATA MLS – KANATA TOWNHOMES FOR SALE – KANATA REAL ESTATE NEWS NOV 17th, 2020.
November 17th 2020
We are seeing a seasonal cooling in the weather, yet the KANATA HOMES FOR SALE AND THE MARKET still looks strong. As you can see from this current prices HOMES SOLD IN KANATA chart for the KANATA PROPERTIES AND PRICES area. This home price chart covers all areas in KANATA homes detached, Townhomes and Condos. The trend is still up and steady in KANATA home prices, yes and still seems to be a Sellers market in KANATA HOMES.
So if you are planning on moving soon, and thinking of SELLING A HOME IN KANATA. We provide a full insight on the KANATA HOME PRICES DAILY. With my FREE KANATA HOME EVALUATION. You will receive all weekly sold prices report showing all sold and expired prices on your Street and on your type of home in KANATA. Ask for our HOME SALES AND SOLD PRICES REPORT if you are thinking of Selling or Buying.
And if you are looking at moving to a better home in KANATA, see our KANATA HOMES FOR SALE, please visit these links below..or below.
Any questions please feel free to send me a request, Have a great day!
KANATA HOME SALES and SOLD REPORT
KANATA HOMES FOR SALE
KANATA HOME PRICES NOV 17, 2020.
OTTAWA AREA HOME SALES STATS
ASK FOR YOUR KANATA NEIGHBORHOOD, HOMES SOLD STATS NOV 17 2020
BRIDLEWOOD HOMES FOR SALE
BRIDLEWOOD REALTOR
BRIDLEWOOD HOMES FOR SALE
Click- KANATA HOMES FOR SALE
FREE HOME EVALUATION 17 NOV 2020
KANATA HOMES FOR SALE
KANATA REAL ESTATE 17 NOV 2020
KANATA HOME PRICING 17 NOV 2020
KANATA NOV 2020 SALE PRICES 17 NOV 2020
KANATA REAL ESTATE AGENT 17 NOV 2020
KANATA HOME NEWS ,17 NOV 2020
KANATA BRIDLEWOOD HOME PRICES 17 NOV 2020
KANATA BRIDLEWOOD HOMES FOR SALE 17 NOV 2020
KANATA MLS – KANATA STREET SOLD PRICES 17 NOV 2020
JUST SOLD HOME PRICES IN BRIDLEWOOD KANATA – AVERAGE PRICES OF HOMES FOR NOV 16, 2020
KANATA HOMES FOR SALE -KANATA HOME NEWS – KANATA HOME PRICES NEWS – KANATA MLS – KANATA TOWNHOMES FOR SALE – KANATA REAL ESTATE NEWS NOV 16TH, 2020.
November 16th 2020
We are seeing a seasonal cooling in the weather, yet the KANATA HOMES FOR SALE AND THE MARKET still looks strong. As you can see from this current prices HOMES SOLD IN KANATA chart for the KANATA PROPERTIES AND PRICES area. This home price chart covers all areas in KANATA homes detached, Townhomes and Condos. The trend is still up and steady in KANATA home prices, yes and still seems to be a Sellers market in KANATA HOMES.
So if you are planning on moving soon, and thinking of SELLING A HOME IN KANATA. We provide a full insight on the KANATA HOME PRICES DAILY. With my FREE KANATA HOME EVALUATION. You will receive all weekly sold prices report showing all sold and expired prices on your Street and on your type of home in KANATA. Ask for our HOME SALES AND SOLD PRICES REPORT if you are thinking of Selling or Buying.
And if you are looking at moving to a better home in KANATA, see our KANATA HOMES FOR SALE, please visit these links below..or below.
Any questions please feel free to send me a request, Have a great day!
KANATA HOME SALES and SOLD REPORT
KANATA HOMES FOR SALE
KANATA HOME PRICES NOV 16, 2020.
ASK FOR YOUR KANATA NEIGHBORHOOD, HOMES SOLD STATS NOV 16 2020
BRIDLEWOOD HOMES FOR SALE
Click- KANATA HOMES FOR SALE
FREE HOME EVALUATION 16 NOV 2020
KANATA HOMES FOR SALE
KANATA REAL ESTATE 16 NOV 2020
KANATA HOME PRICING 16 NOV 2020
KANATA NOV 2020 SALE PRICES16 NOV 2020
KANATA REAL ESTATE AGENT 16 NOV 2020
KANATA HOME NEWS ,16 NOV 2020
KANATA BRIDLEWOOD HOME PRICES 16 NOV 2020
KANATA BRIDLEWOOD HOMES FOR SALE 16 NOV 2020
KANATA MLS – KANATA STREET SOLD PRICES 16 NOV 2020
JUST SOLD HOME PRICES IN BRIDLEWOOD KANATA
KANATA HOMES FOR SALE -KANATA HOME NEWS – KANATA HOME PRICES NEWS – KANATA MLS – KANATA TOWNHOMES FOR SALE – KANATA REAL ESTATE NEWS NOV 16TH, 2020.
November 16th 2020
We are seeing a seasonal cooling in the weather, yet the KANATA HOMES FOR SALE AND THE MARKET still looks strong. As you can see from this current prices HOMES SOLD IN KANATA chart for the KANATA PROPERTIES AND PRICES area. This home price chart covers all areas in KANATA homes detached, Townhomes and Condos. The trend is still up and steady in KANATA home prices, yes and still seems to be a Sellers market in KANATA HOMES.
So if you are planning on moving soon, and thinking of SELLING A HOME IN KANATA. We provide a full insight on the KANATA HOME PRICES DAILY. With my FREE KANATA HOME EVALUATION. You will receive all weekly sold prices report showing all sold and expired prices on your Street and on your type of home in KANATA. Ask for our HOME SALES AND SOLD PRICES REPORT if you are thinking of Selling or Buying.
And if you are looking at moving to a better home in KANATA, see our KANATA HOMES FOR SALE, please visit these links below..or below.
Any questions please feel free to send me a request, Have a great day!
Links:
KANATA HOME SALES and SOLD REPORT
KANATA HOMES FOR SALE
KANATA HOME PRICES NOV 16, 2020.
ASK FOR YOUR KANATA NEIGHBORHOOD, HOMES SOLD STATS NOV 16 2020
KANATA HOMES FOR SALE


