
Blog
Tag: KANATA HOME PRICING
July 27th, 2023
All homes available for sale in Kanata.
Searching for homes for sale in Kanata? Look no further than The KENNEDY Real Estate Team. With several years of experience in selling homes in Kanata. We have extensive knowledge about various models, builders, and neighbourhoods such as: Beaverbrook, Katimavik, Bridlewood, Kanata Lakes, Morgan’s Grant, Trail West, and Elmwood.
In Kanata Ontario, there are several types of dwellings available: Single detached homes, row units townhouses, semi-detached homes, stacked townhouses, and apartments.
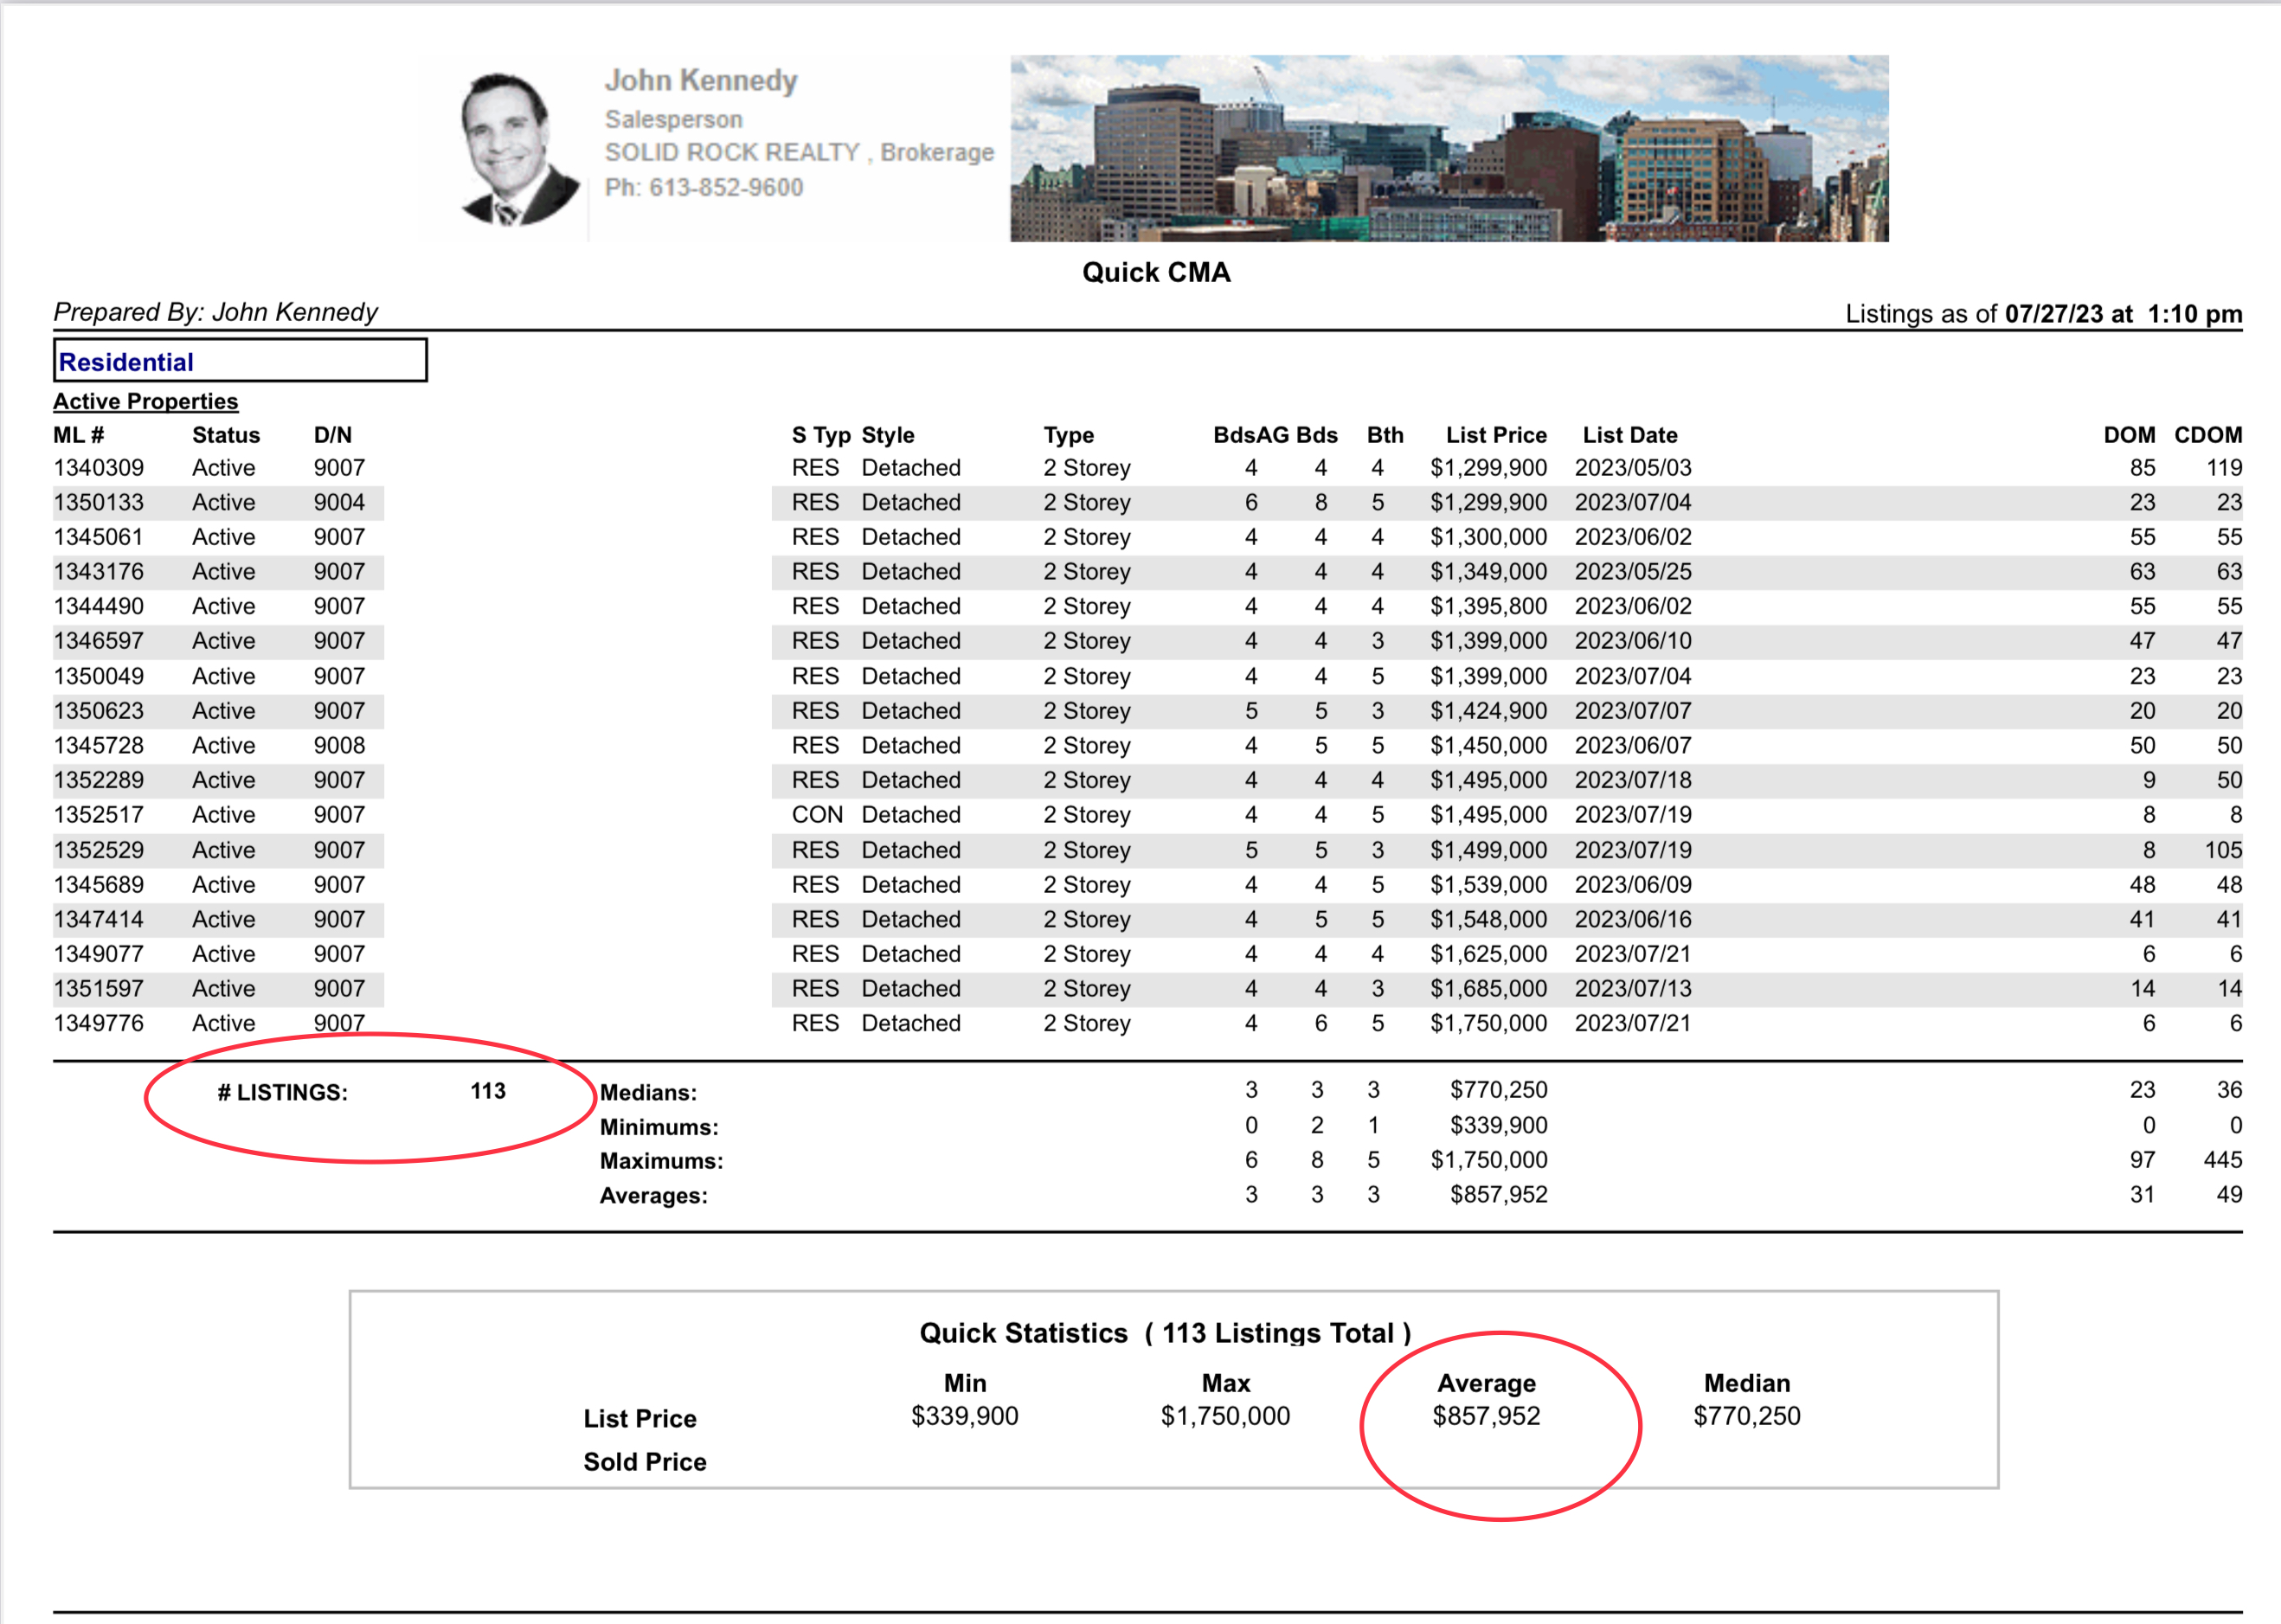
We are Currently seeking, 113 listings for sale in Kanata with an average price of approximately:
ALL JULY 2023 DETACHED HOMES AVERAGE PRICE $857,900.
Count on us to provide you with the true value. This free service will ensure you make an informed decision for your next home purchase in Kanata.
ASK FOR OUR FREE “PROPERTY REPORT ON VALUE AND COMPARABLE”.

Get all details – Copy/Paste MLS number here.
Search a Street, City, Province, RP Number or MLS® Number
All Kanata Home Listings on our IDX website.
| ML# | Address | List Price | Type | Style | Bds | Bths |
| 1349274 | 1016 TANGUAY CRT | $339,900 | 2STOREY | STACK | 2 | 2 |
| 1346861 | 1006 TANGUAY CRT | $349,900 | 2STOREY | STACK | 2 | 2 |
| 1347644 | 103 SALTER CRES | $379,900 | 2STOREY | ROW | 3 | 2 |
| 1353521 | 239 PICKFORD DR | $429,900 | 2STOREY | ROW | 3 | 2 |
| 1352685 | 21 BEST WAY | $438,000 | 2STOREY | ROW | 3 | 3 |
| 1345297 | 2033 CAMPEAU DR | $449,000 | 2STOREY | STACK | 2 | 2 |
| 1347915 | 300 TULUM CRES #H | $485,000 | 1LEVEL | STACK | 2 | 1 |
| 1339787 | 310 TULUM CRES #C | $499,900 | OTHER | STACK | 2 | 2 |
| 1339789 | 310 TULUM CRES #B | $499,900 | OTHER | STACK | 2 | 2 |
| 1349944 | 106 KINCARDINE DR | $516,000 | 2STOREY | ROW | 2 | 3 |
| 1344162 | 598 FOXLIGHT CIR | $528,900 | 3STOREY | ROW | 2 | 3 |
| 1352430 | 373 HILLSBORO PVT | $534,900 | 2STOREY | ROW | 3 | 3 |
| 1353245 | 21 STREAMBANK ST | $539,900 | 3STOREY | ROW | 2 | 2 |
| 1351777 | 516 ABERFOYLE CIR | $549,900 | 2STOREY | ROW | 3 | 2 |
| 1351967 | 1505 CAMPEAU DR | $549,999 | 2STOREY | STACK | 2 | 3 |
| 1351412 | 14 MEADOWBREEZE DR | $550,000 | 2STOREY | ROW | 3 | 3 |
| 1351319 | 29 STREAMBANK ST | $558,000 | 3STOREY | ROW | 3 | 2 |
| 1352962 | 127 ATTWELL PVT | $559,900 | 3STOREY | ROW | 2 | 3 |
| 1350428 | 161 ATTWELL PVT | $569,000 | 3STOREY | ROW | 2 | 2 |
| 1338221 | 398 HILLSBORO PVT | $569,900 | 2STOREY | ROW | 3 | 3 |
| 1350177 | 63 SPRINGCREEK CRES | $575,000 | 2STOREY | ROW | 3 | 2 |
| 1351338 | 4 SUNNYBROOKE DR | $575,000 | 2STOREY | ROW | 3 | 2 |
| 1351016 | 60 HELMSDALE DR | $599,900 | 2STOREY | ROW | 3 | 3 |
| 1351828 | 833 TABARET ST | $618,000 | 2STOREY | ROW | 3 | 3 |
| 1353591 | 586 BARRICK HILL RD | $619,900 | 2STOREY | ROW | 3 | 3 |
| 1353394 | 1326 HALTON TERR | $625,000 | 2STOREY | ROW | 3 | 3 |
| 1349339 | 738 OAKGLADE AVE | $629,900 | 2STOREY | ROW | 3 | 3 |
| 1352422 | 220 FORESTBROOK ST | $639,000 | 2STOREY | ROW | 3 | 3 |
| 1351156 | 94 SADDLESMITH CIR | $639,000 | 2STOREY | ROW | 3 | 3 |
| 1352406 | 201 OPUS ST | $649,900 | 2STOREY | ROW | 3 | 3 |
| 1352958 | 80 ROBARTS CRES | $649,900 | 2STOREY | ROW | 3 | 4 |
| 1352924 | 276 MAXWELL BRIDGE RD | $649,900 | 2STOREY | ROW | 3 | 3 |
| 1346702 | 30 HIGHMONT CRT | $650,000 | 2STOREY | SEMIDET | 3 | 3 |
| 1353652 | 29 COURTNEY RD | $654,900 | BUNGLOW | DETACH | 4 | 2 |
| 1346498 | 218 HUNTERBROOK ST N | $659,999 | 2STOREY | ROW | 3 | 3 |
| 1346233 | 100 PATRIOT PL | $669,900 | 2STOREY | ROW | 3 | 3 |
| 1350846 | 560 PEPPERVILLE CRES | $669,900 | 2STOREY | ROW | 3 | 3 |
| 1350828 | 120 SPRINGCREEK CRES | $674,900 | 2STOREY | DETACH | 3 | 2 |
| 1340559 | 804 STAR PVT | $684,900 | 3STOREY | ROW | 2 | 4 |
| 1343773 | 31 BACHMAN TERR | $694,900 | 3STOREY | ROW | 2 | 4 |
| 1342872 | 58 BLACKDOME CRES | $699,000 | 2STOREY | ROW | 3 | 2 |
| 1351794 | 7 CURRAN ST | $699,000 | 2STOREY | DETACH | 3 | 2 |
| 1347144 | 80 GOLDRIDGE DR | $699,900 | 2STOREY | ROW | 3 | 3 |
| 1350013 | 70 MERSEY AVE | $699,900 | 2STOREY | DETACH | 3 | 3 |
| 1343158 | 27 BACHMAN TERR | $704,900 | 3STOREY | ROW | 4 | 4 |
| 1345027 | 45 BACHMAN TERR | $714,900 | 3STOREY | ROW | 3 | 3 |
| 1344899 | 110 MACASSA CIR | $724,900 | SPLIT | ROW | 3 | 3 |
| 1348075 | 51 WATERTHRUSH CRES | $724,900 | BUNGLOW | SEMIDET | 3 | 3 |
| 1333567 | 69 EQUESTRIAN DR | $729,900 | 2STOREY | DETACH | 3 | 3 |
| 1344890 | 37 BACHMAN TERR | $734,900 | 3STOREY | ROW | 4 | 4 |
| 1350053 | 993 KLONDIKE RD | $735,000 | 2STOREY | ROW | 3 | 3 |
| 1339680 | 432 MEADOWBREEZE DR | $739,900 | 2STOREY | ROW | 4 | 3 |
| 1349133 | 283 KINGHAVEN CRES | $749,000 | 2STOREY | ROW | 3 | 4 |
| 1347577 | 95 VILLAGE GREEN | $749,999 | 2STOREY | DETACH | 4 | 2 |
| 1345492 | 21 WESTMEATH CRES | $757,000 | 2STOREY | DETACH | 3 | 3 |
| 1352433 | 2 SEWELL WAY | $769,900 | 2STOREY | DETACH | 4 | 3 |
| 1348719 | 554 HITZLAY CRES | $770,250 | 2STOREY | ROW | 3 | 3 |
| 1352974 | 66 MACASSA CIR | $790,000 | 3STOREY | ROW | 2 | 3 |
| 1352026 | 42 FOULIS CRES | $794,000 | BUNGLOW | ROW | 3 | 3 |
| 1348104 | 4 TURNBULL AVE | $799,900 | 2STOREY | DETACH | 3 | 3 |
| 1351607 | 26 FOXLEIGH CRES | $799,900 | 2STOREY | DETACH | 4 | 4 |
| 1353089 | 33 SPUR AVE | $799,900 | 2STOREY | DETACH | 4 | 4 |
| 1353349 | 58 BRIDLE PARK DR | $799,900 | 2STOREY | DETACH | 4 | 3 |
| 1347391 | 182 OVERBERG WAY | $809,900 | 2STOREY | ROW | 3 | 4 |
| 1352046 | 194 FLOWING CREEK CIR | $829,900 | 2STOREY | DETACH | 4 | 4 |
| 1348237 | 65 CROWNRIDGE DR | $839,900 | 2STOREY | DETACH | 3 | 3 |
| 1352949 | 24 RIVERGREEN CRES | $839,900 | 2STOREY | DETACH | 3 | 3 |
| 1352972 | 140 BRIDGESTONE DR | $849,900 | 2STOREY | DETACH | 4 | 3 |
| 1339798 | 819 PETRA PVT | $850,000 | 3STOREY | ROW | 3 | 4 |
| 1352306 | 135 SOLARIS DR | $855,000 | 2STOREY | DETACH | 4 | 4 |
| 1351387 | 441 TILLSONBURG ST | $875,000 | 2STOREY | DETACH | 3 | 3 |
| 1350782 | 122 WHERNSIDE TERR | $885,000 | 2STOREY | DETACH | 4 | 4 |
| 1353183 | 2 BRADLEY FARM CRT | $899,900 | 2STOREY | DETACH | 4 | 4 |
| 1346499 | 4 BRADLEY FARM CRT | $899,999 | 2STOREY | DETACH | 6 | 4 |
| 1348913 | 26 PELLAN CRES N | $936,000 | 2STOREY | DETACH | 4 | 3 |
| 1348723 | 15 RUTHERFORD CRES | $945,000 | 2STOREY | DETACH | 4 | 3 |
| 1346322 | 803 OAKSIDE CRES | $959,000 | 2STOREY | DETACH | 5 | 4 |
| 1348720 | 360 ABBEYDALE CIR | $969,900 | 2STOREY | DETACH | 4 | 3 |
| 1346305 | 614 BRIDLEGLEN CRES | $979,990 | 2STOREY | DETACH | 3 | 3 |
| 1330947 | 27 SOLARIS DR | $989,900 | 2STOREY | DETACH | 4 | 4 |
| 1350083 | 19 RUTHERFORD CRES | $989,900 | 2STOREY | DETACH | 4 | 4 |
| 1342008 | 42 STONECROFT TERR | $998,000 | BUNGLOW | DETACH | 4 | 3 |
| 1346782 | 178 GYRFALCON CRES | $999,000 | 2STOREY | DETACH | 5 | 4 |
| 1347064 | 11 TURTLE POINT PVT | $999,000 | BGWL | ROW | 4 | 4 |
| 1347484 | 2004 ALLEGRINI TERR | $999,900 | 2STOREY | DETACH | 4 | 3 |
| 1343628 | 343 SUGAR PINE CRES | $1,029,000 | 2STOREY | DETACH | 3 | 3 |
| 1350372 | 10 JARLAN TERR | $1,039,000 | 2STOREY | DETACH | 4 | 3 |
| 1346589 | 11 MENDOZA WAY | $1,049,000 | 2STOREY | DETACH | 4 | 3 |
| 1352264 | 328 LAUGHLIN CIR | $1,050,000 | 2STOREY | DETACH | 4 | 3 |
| 1345277 | 8 EVANSHEN CRES | $1,100,000 | 2STOREY | DETACH | 4 | 3 |
| 1350338 | 26 VARLEY DR | $1,150,000 | 2STOREY | DETACH | 4 | 3 |
| 1349314 | 9 ROSETHORN WAY | $1,188,800 | 2STOREY | DETACH | 5 | 4 |
| 1345120 | 138 STEEPLE CHASE DR | $1,199,900 | 2STOREY | DETACH | 4 | 4 |
| 1350186 | 36 ROSENFELD CRES | $1,225,000 | 2STOREY | DETACH | 4 | 4 |
| 1340309 | 123 GRAINSTONE WAY | $1,299,900 | 2STOREY | DETACH | 4 | 4 |
| 1350133 | 50 OSPREY CRES | $1,299,900 | 2STOREY | DETACH | 8 | 5 |
| 1345061 | 28 GREENSAND PL | $1,300,000 | 2STOREY | DETACH | 4 | 4 |
| 1343176 | 396 HUNTSVILLE DR | $1,349,000 | 2STOREY | DETACH | 4 | 4 |
| 1344490 | 250 KETCHIKAN CRES | $1,395,800 | 2STOREY | DETACH | 4 | 4 |
| 1346597 | 55 IRONSIDE CRT | $1,399,000 | 2STOREY | DETACH | 4 | 3 |
| 1350049 | 523 BRECCIA HTS | $1,399,000 | 2STOREY | DETACH | 4 | 5 |
| 1350623 | 139 INGERSOLL CRES | $1,424,900 | 2STOREY | DETACH | 5 | 3 |
| 1345728 | 348 ABBEYDALE CIR | $1,450,000 | 2STOREY | DETACH | 5 | 5 |
| 1352289 | 60 ROSENFELD CRES | $1,495,000 | 2STOREY | DETACH | 4 | 4 |
| 1352517 | 15 KANATA ROCKERIES PVT | $1,495,000 | 2STOREY | DETACH | 4 | 5 |
| 1352529 | 65 IRONSIDE CRT | $1,499,000 | 2STOREY | DETACH | 5 | 3 |
| 1345689 | 1098 BLANDING ST | $1,539,000 | 2STOREY | DETACH | 4 | 5 |
| 1347414 | 525 BRECCIA HTS | $1,548,000 | 2STOREY | DETACH | 5 | 5 |
| 1349077 | 44 IRONSIDE CRT | $1,625,000 | 2STOREY | DETACH | 4 | 4 |
| 1351597 | 3 GOULDING CRES | $1,685,000 | 2STOREY | DETACH | 4 | 3 |
| 1349776 | 65 WALDEN DR | $1,750,000 | 2STOREY | DETACH | 6 | 5 |
Homes for sale in Kanata – Homes for sale in Ottawa

Count on us to provide you with the true value. This free service will ensure you make an informed decision for your next home purchase in Kanata.
ASK FOR OUR FREE “PROPERTY REPORT ON VALUE AND COMPARABLE”.
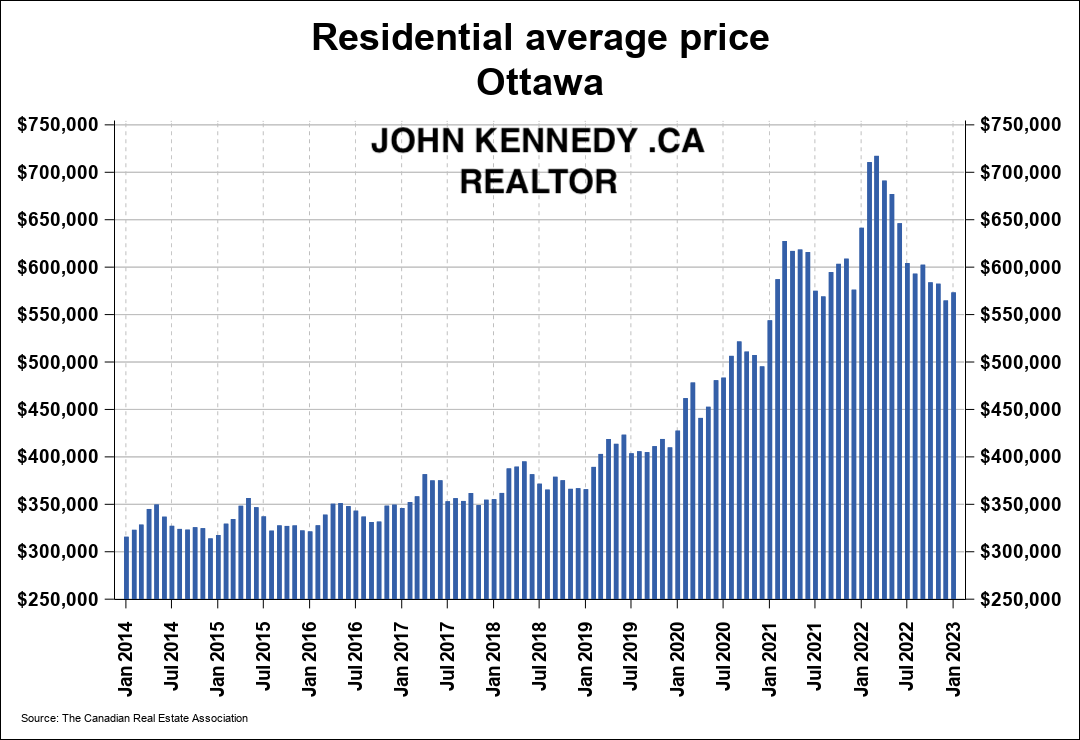
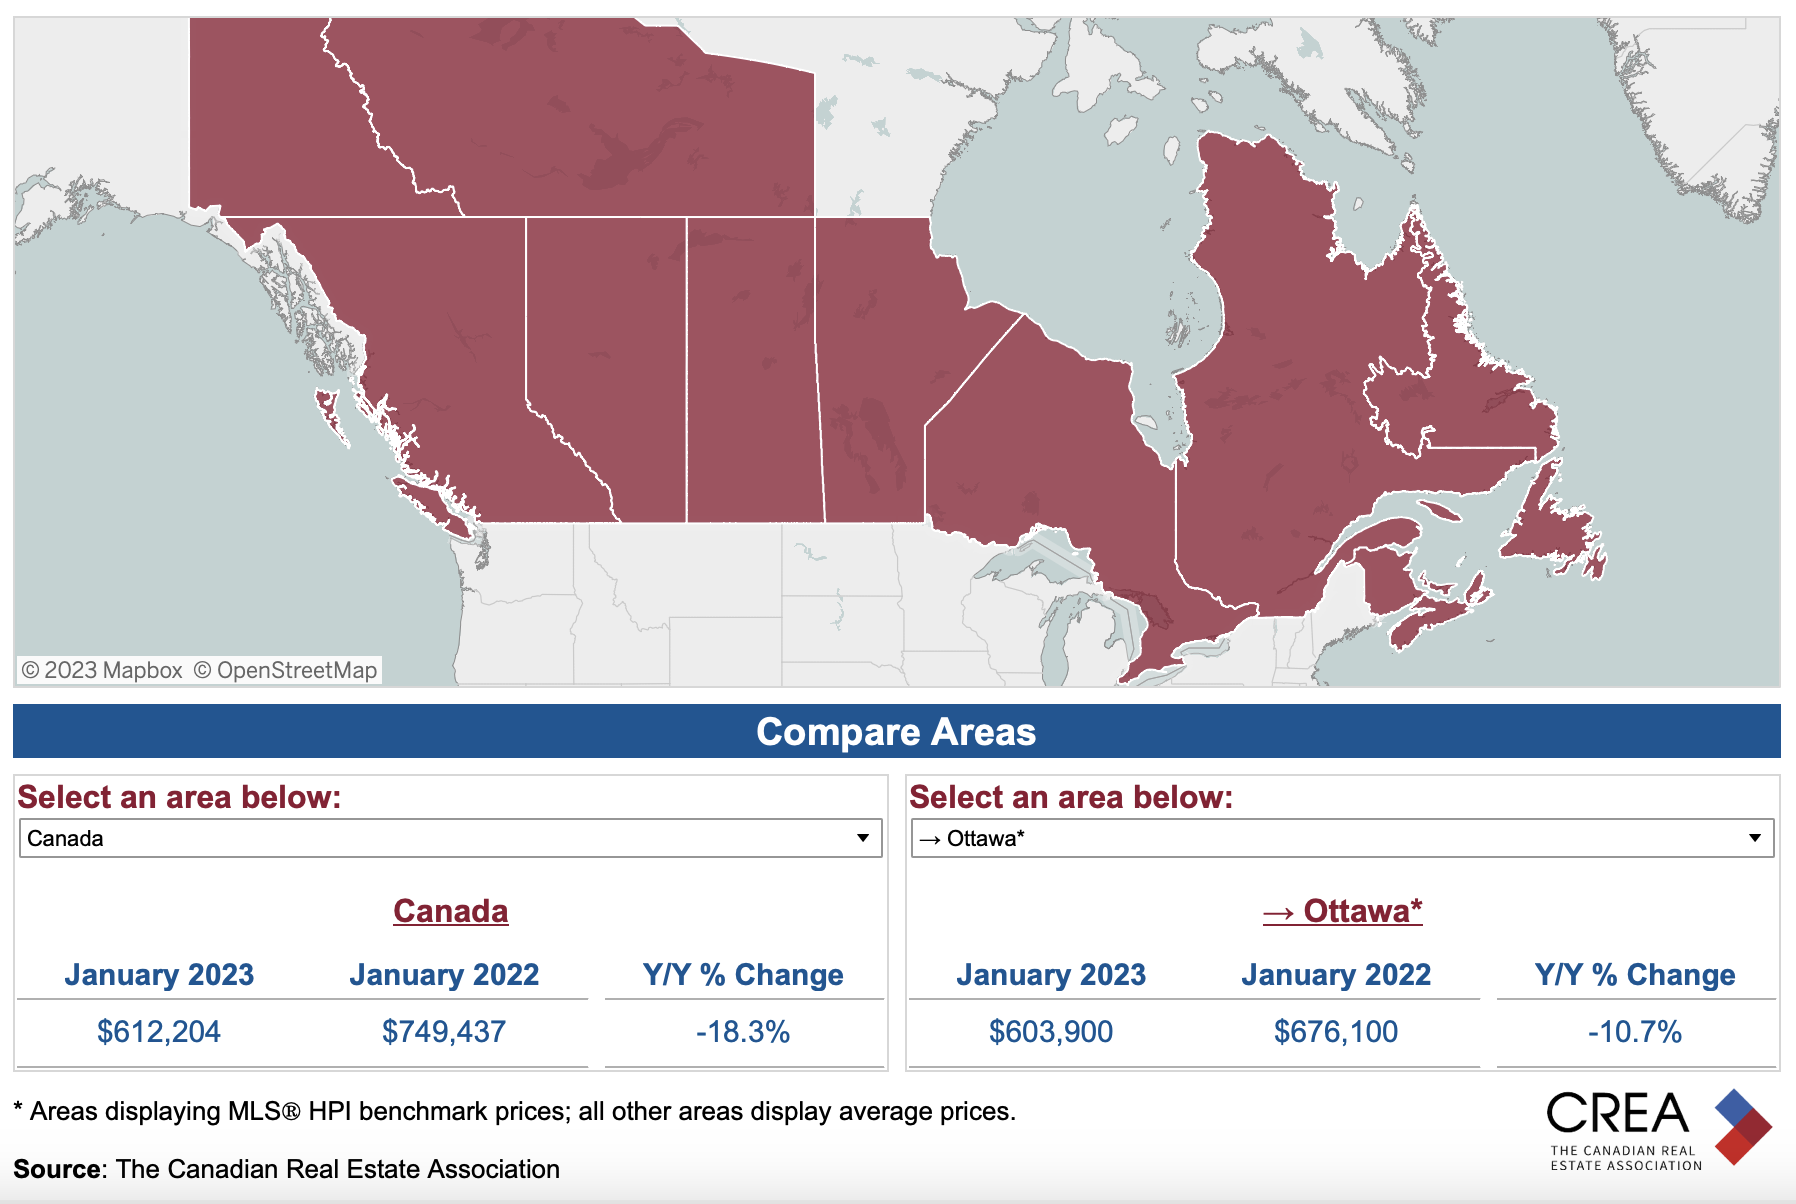
Residential in Ottawa Real Estate shows -15% Down from last year Average price – However, it marks a 5% increase over January 2023.
Resale Market Stabilizes in February with a Glimmer of Hope for Buyers and Sellers Alike!
OREB NEWS
March 3, 2023
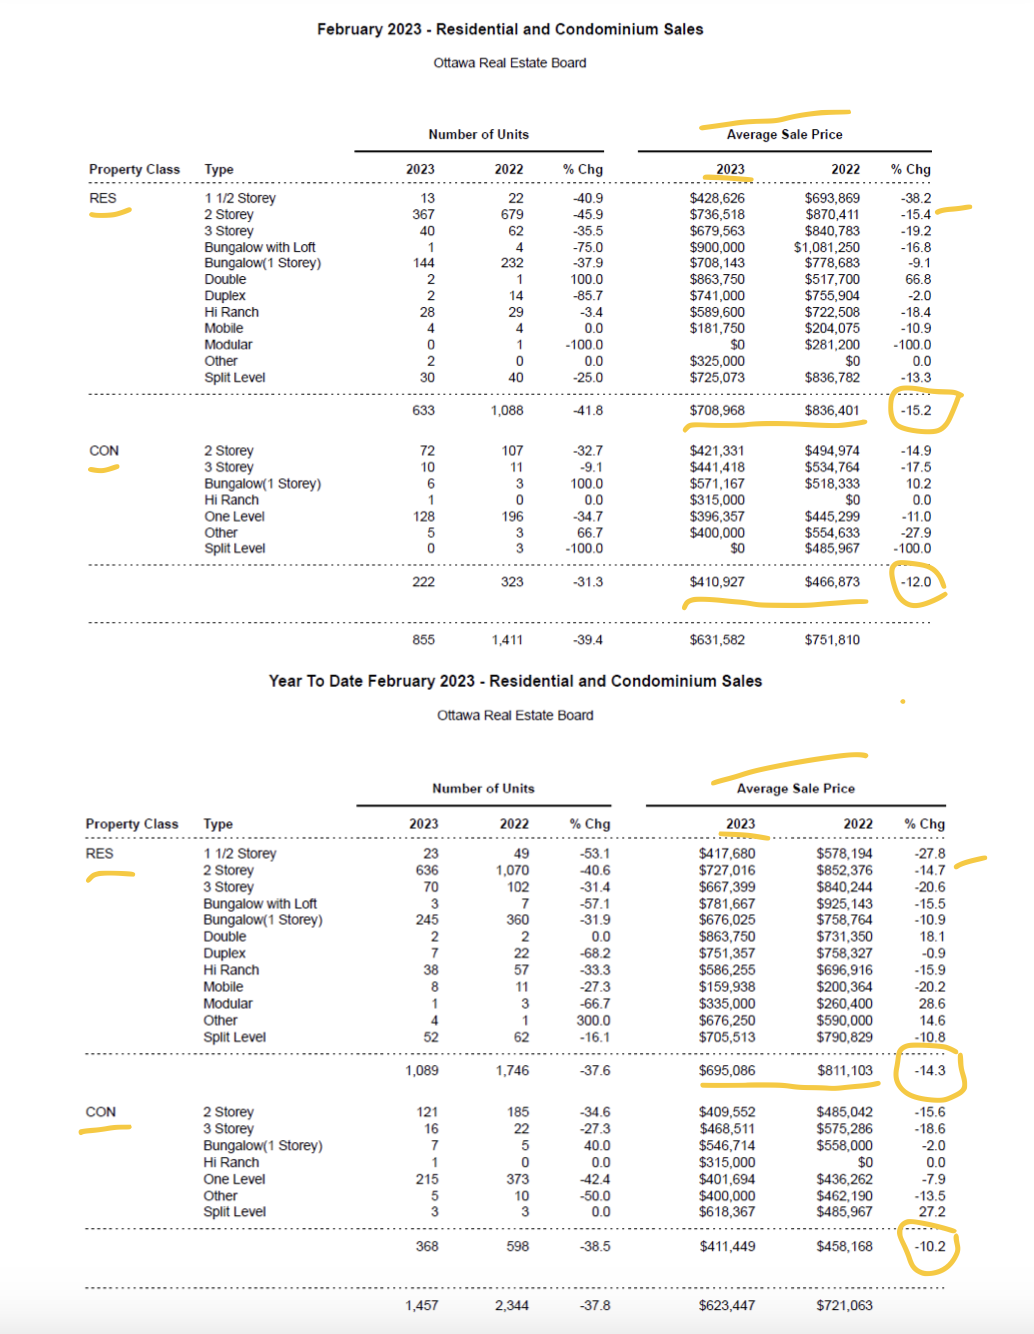
Members of the Ottawa Real Estate Board (OREB) sold 855 residential properties in February through the Board’s Multiple Listing Service® (MLS®) System, compared with 1,411 in February 2022, a decrease of 39%. February’s sales included 633 in the freehold-property class, down 42% from a year ago, and 222 in the condominium-property category, a decrease of 31% from February 2022. The five-year average for total unit sales in February is 1,157.
“We’re going to see declines in transactions and prices when we compare current figures to last February — the height of the pandemic resale market activity,” says Ottawa Real Estate Board’s President Ken Dekker. “On the other hand, with the Bank of Canada holding interest rates steady, prospective buyers have more budget certainty to work with as we head into the spring market.”
By the Numbers – Average Prices*:
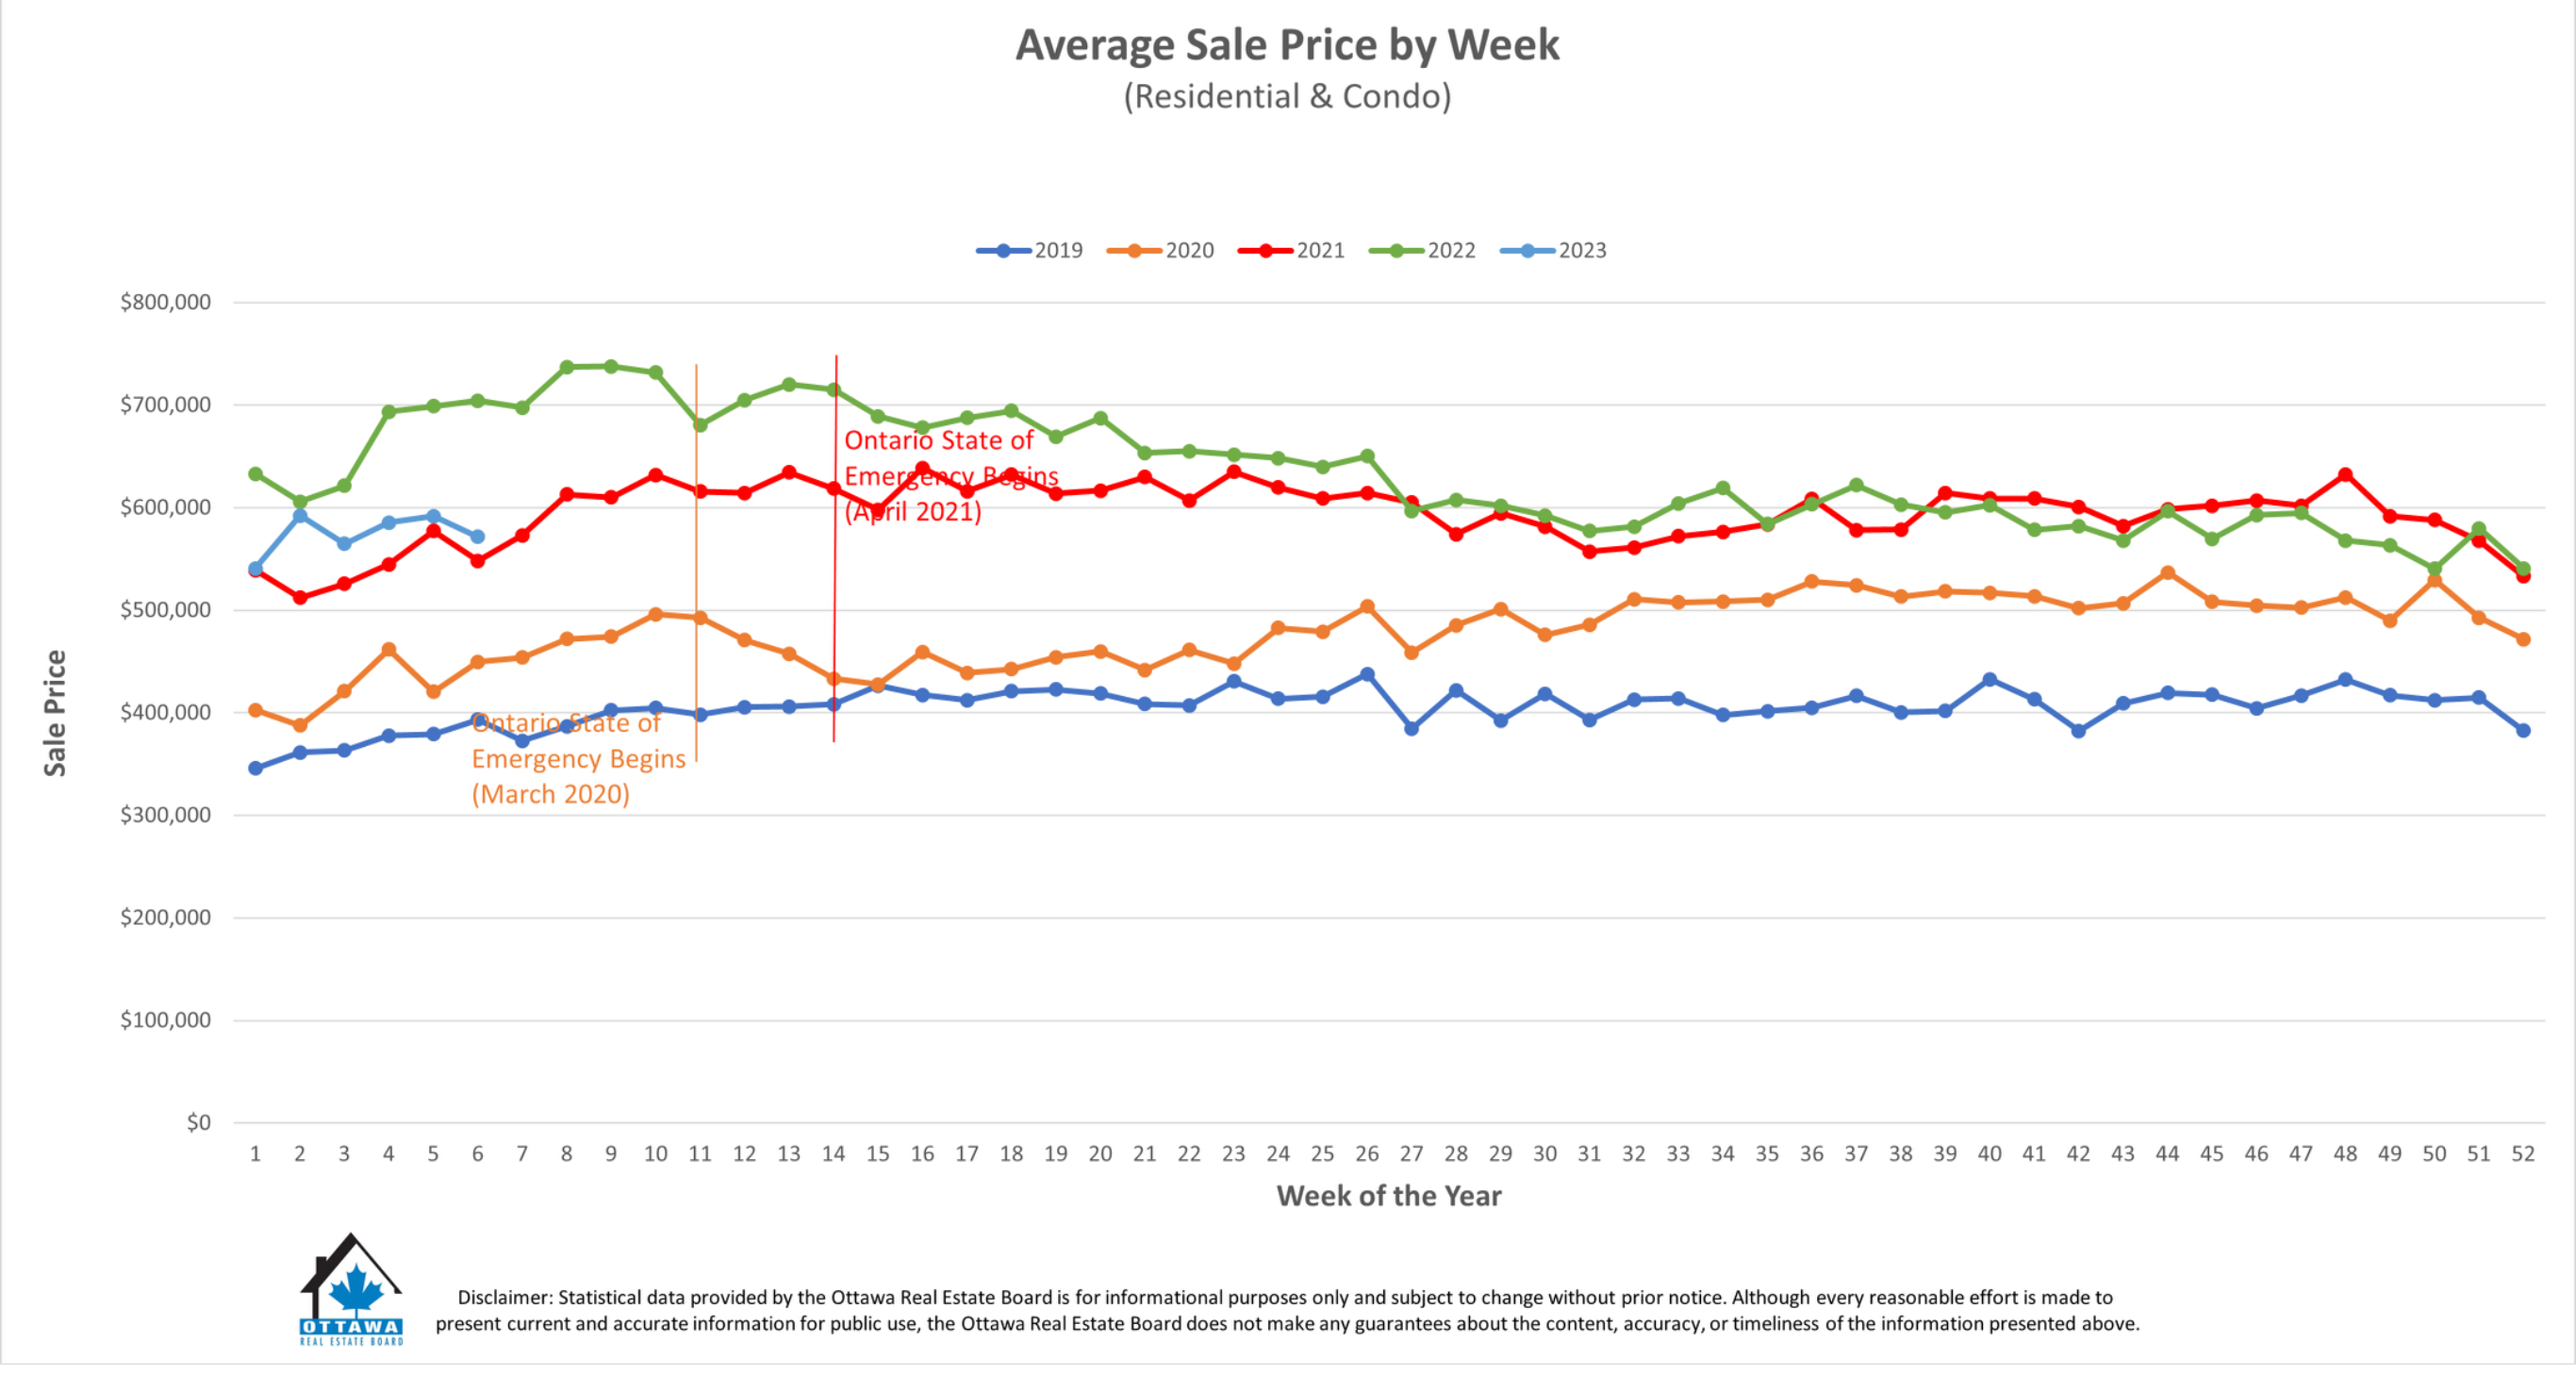
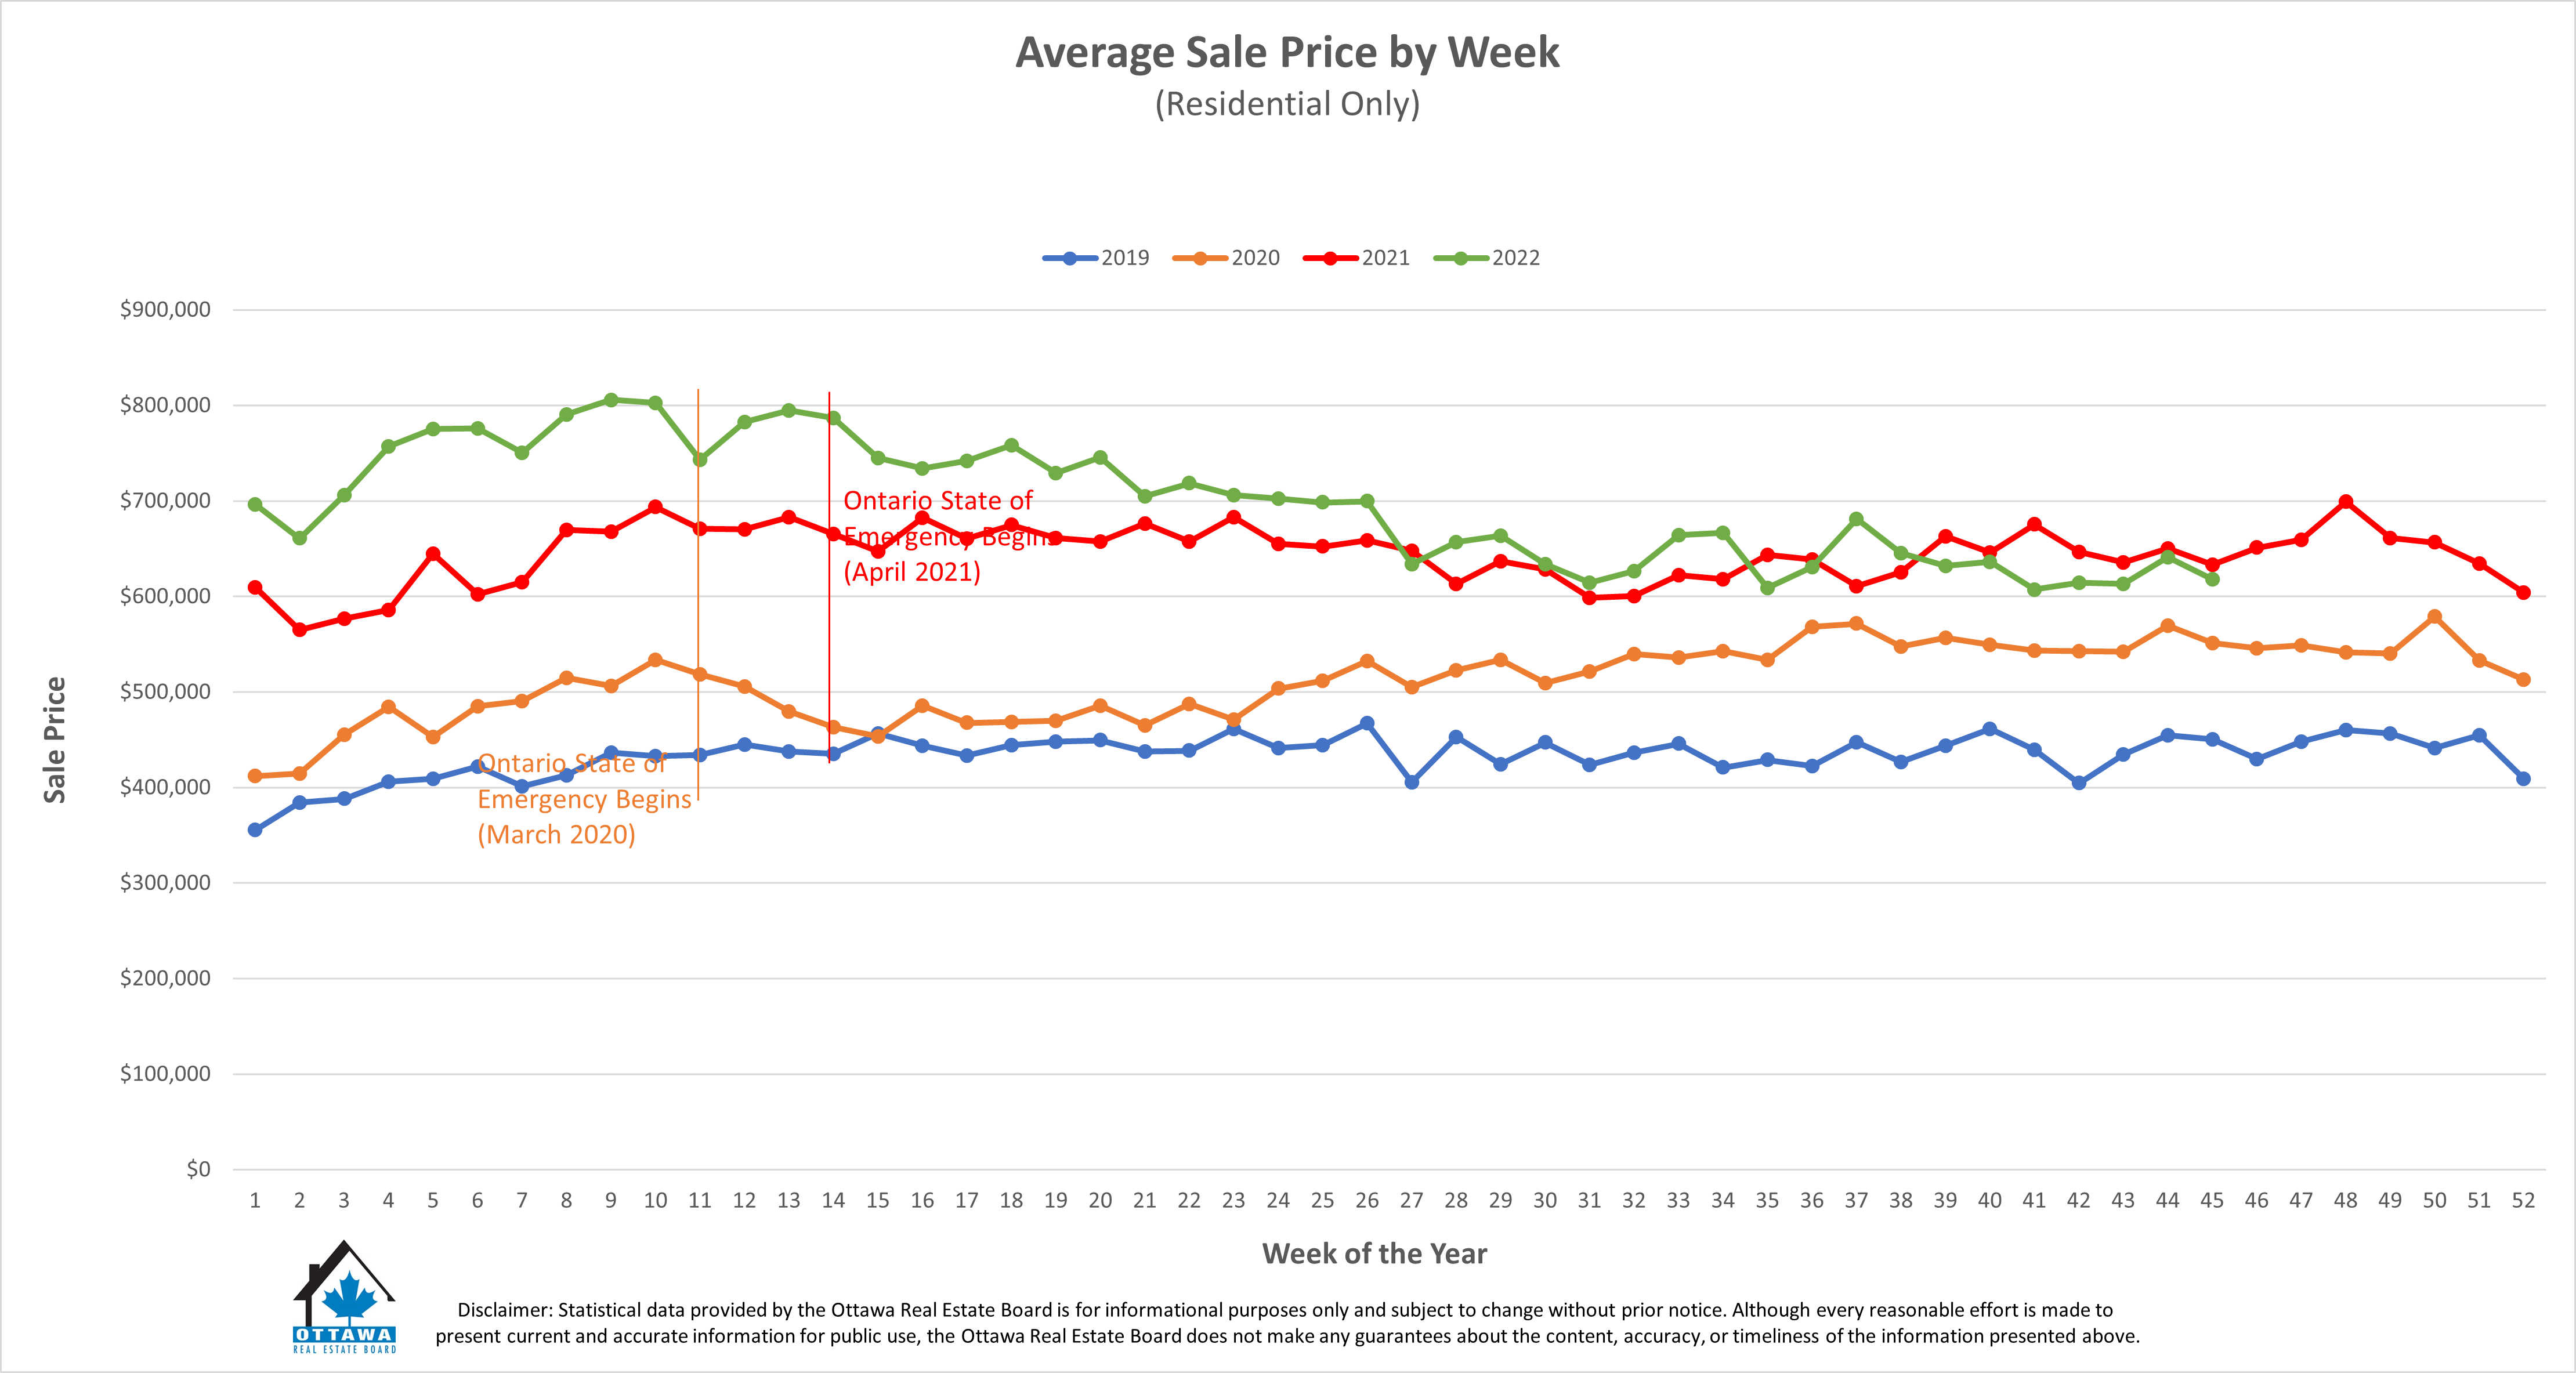
- The average sale price for a freehold-class property in February was $708,968, a decrease of 15% from 2022. However, it marks a 5% increase over January 2023.
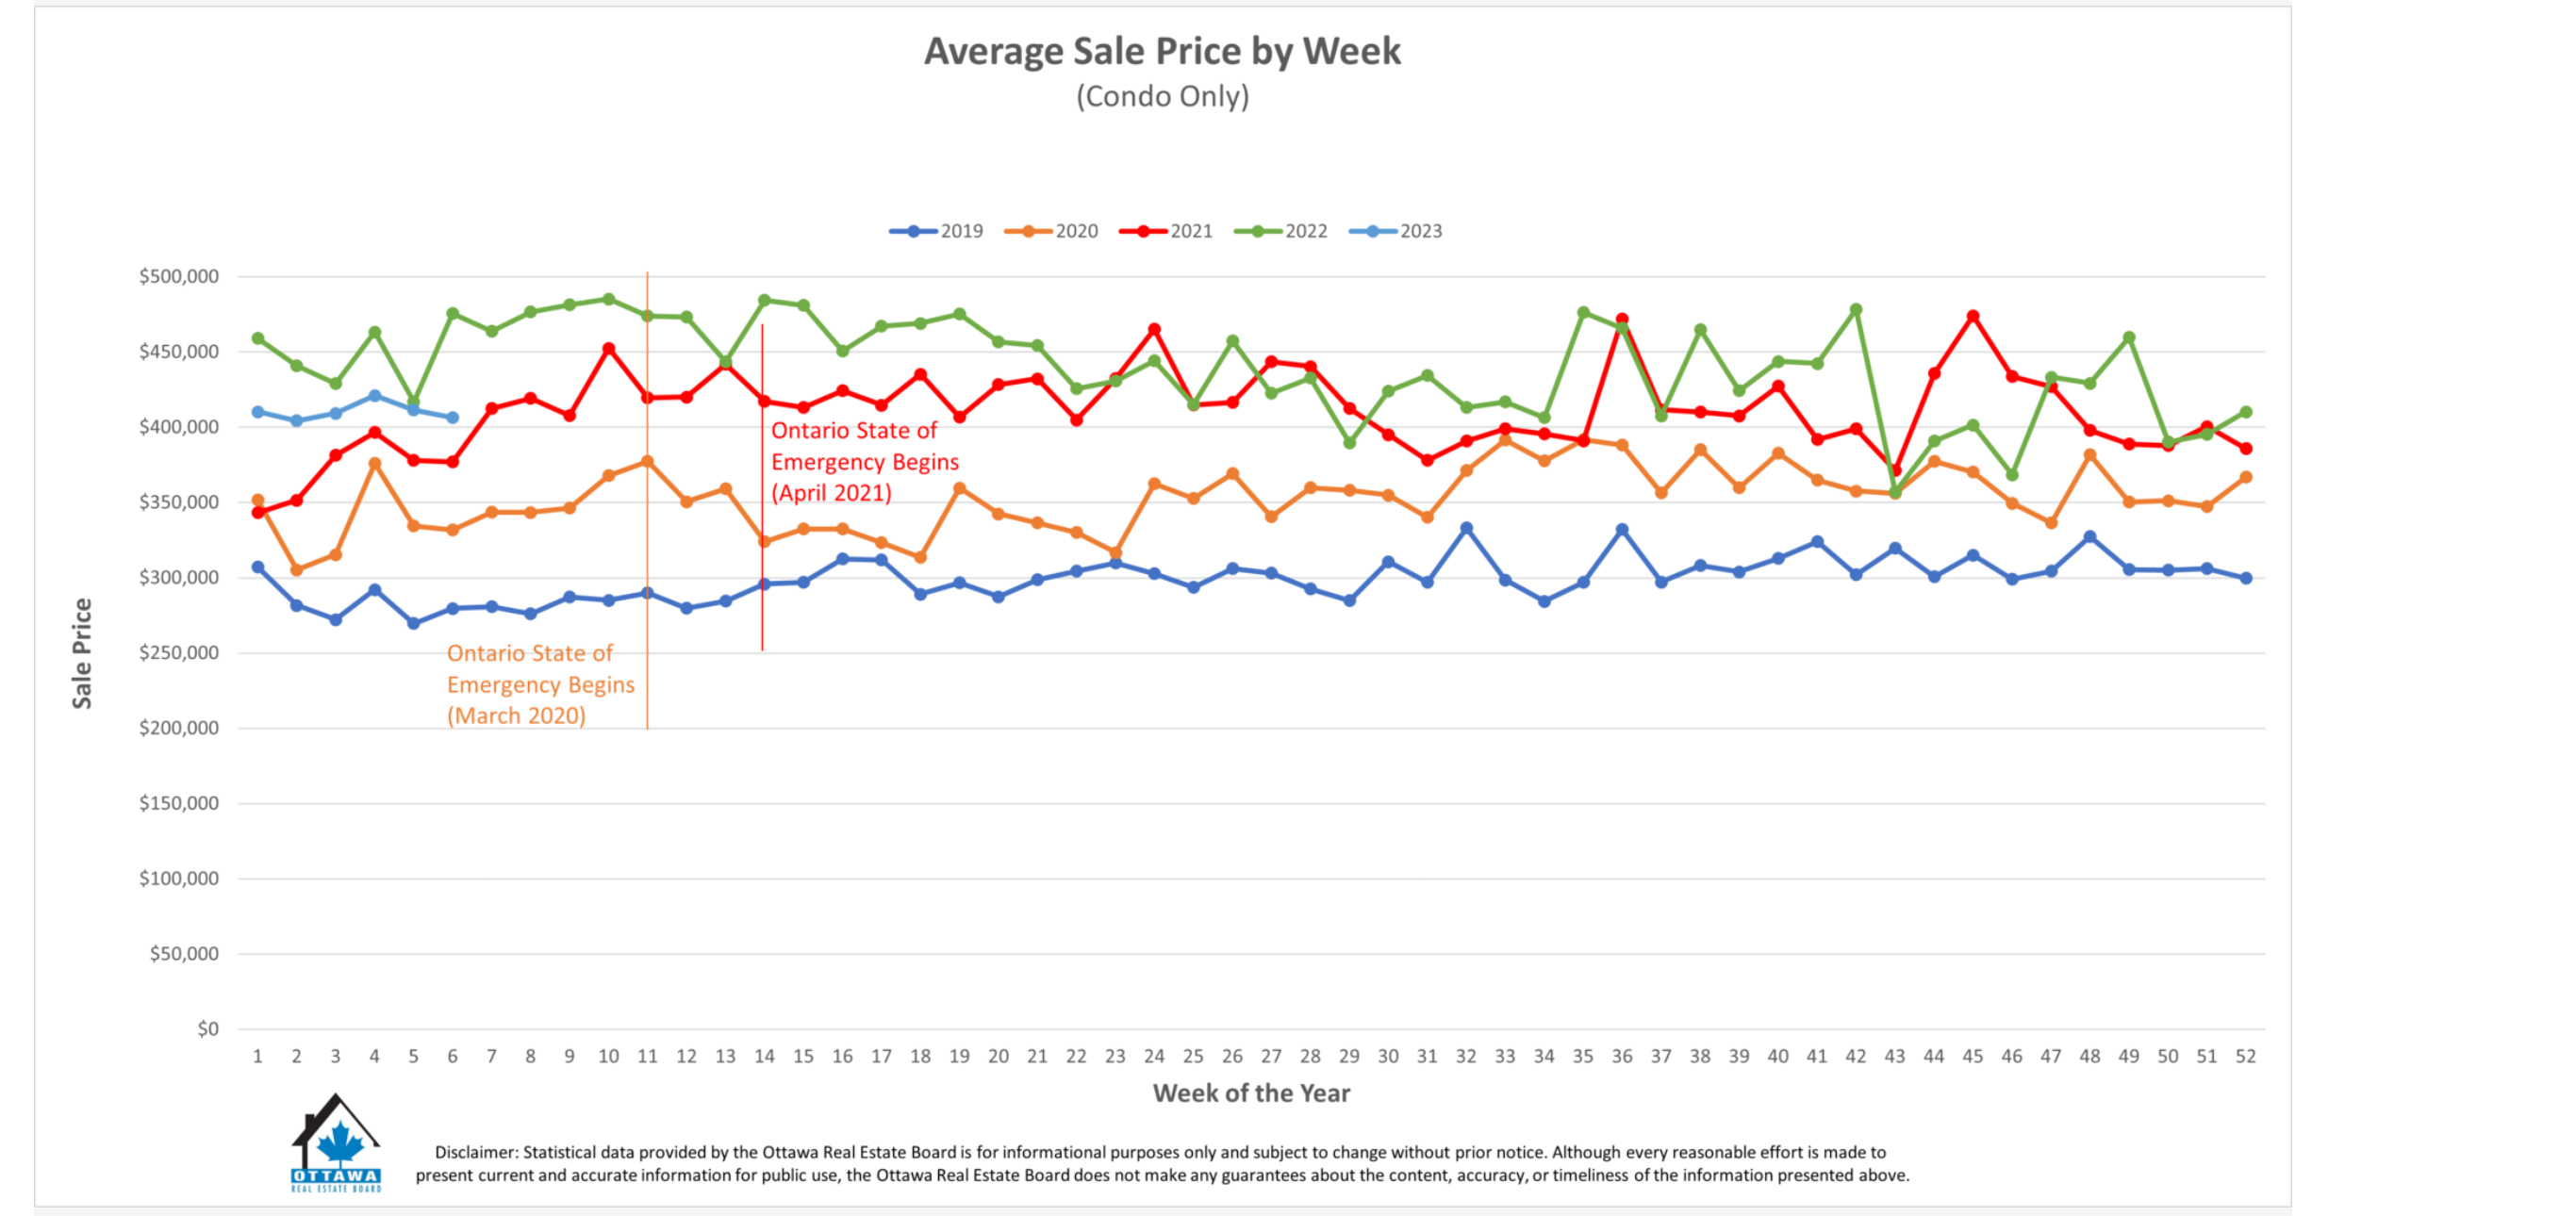
- The average sale price for a condominium-class property was $410,927, decreasing 12% from a year ago.
- With year-to-date average sale prices at $695,086 for freeholds and $411,449 for condos, these values represent a 14% decrease over 2022 for freehold-class properties and a 10% decrease for condominium-class properties.
“The average price increase for freeholds over January could be an indicator that buyers have normalized to the current interest rates. And perhaps, it’s a glimmer of more activity to come in the months ahead.”
By the Numbers – Inventory & New Listings:
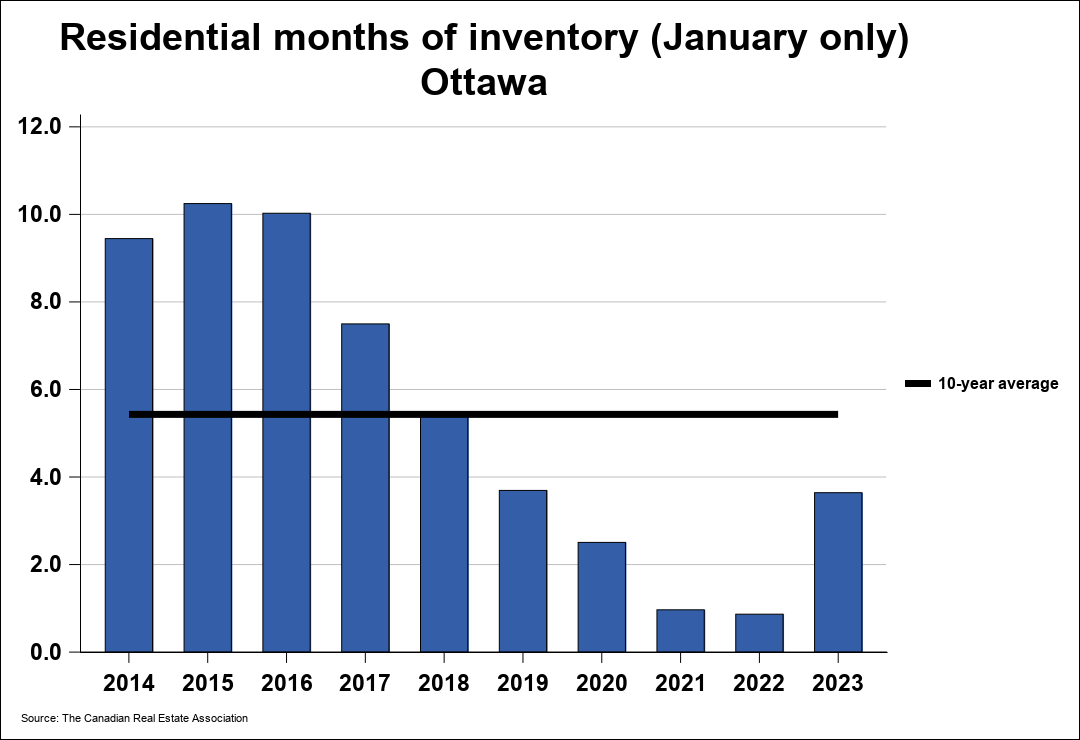
- Months of Inventory for the freehold-class properties has increased to 2.8 months from 0.7 months in February 2022.
- Months of Inventory for condominium-class properties has increased to 2.5 months from 0.7 months in February 2022.
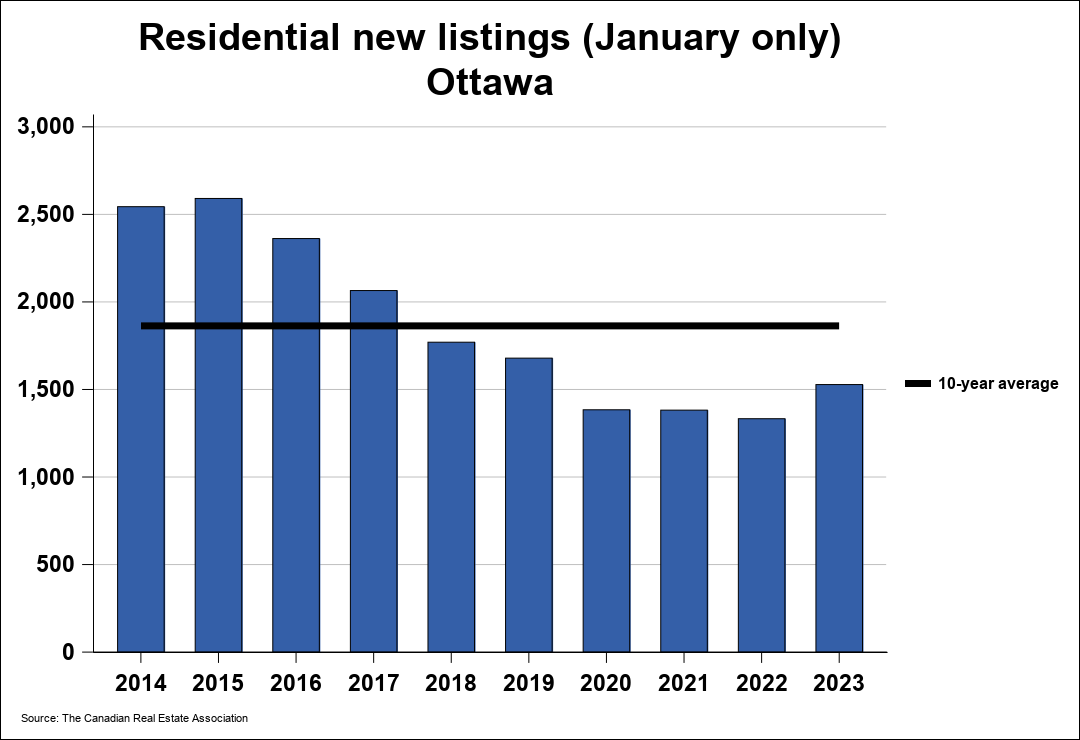
- February’s new listings (1,366) were 22% lower than February 2022 (1,762) and up 3% from January 2023 (1,323). The 5-year average for new listings in February is 1,632.
- Days on market (DOM) for freeholds decreased from 43 to 37 days and 47 to 43 days for condos compared to last month.
“A decrease in the days on market, paired with fewer new listings entering the market, is good news for sellers,” says Dekker. “However, if that trend continues to impact our supply stock and we don’t get more inventory, our otherwise balanced market could swing back into seller’s territory — but it’s too early to predict.”
“The best advice for sellers and buyers in today’s market is to pay close attention to the comparison and competition insights only a REALTOR® can offer. Ottawa is made up of many micro-markets, and neighbourhood-level data is vital to standing out and closing deals.”
REALTORS® also help with finding rentals and vetting potential tenants. Since the beginning of the year, OREB Members have assisted clients with renting 995 properties compared to 800 last year at this time, an increase of 24%.
Details:
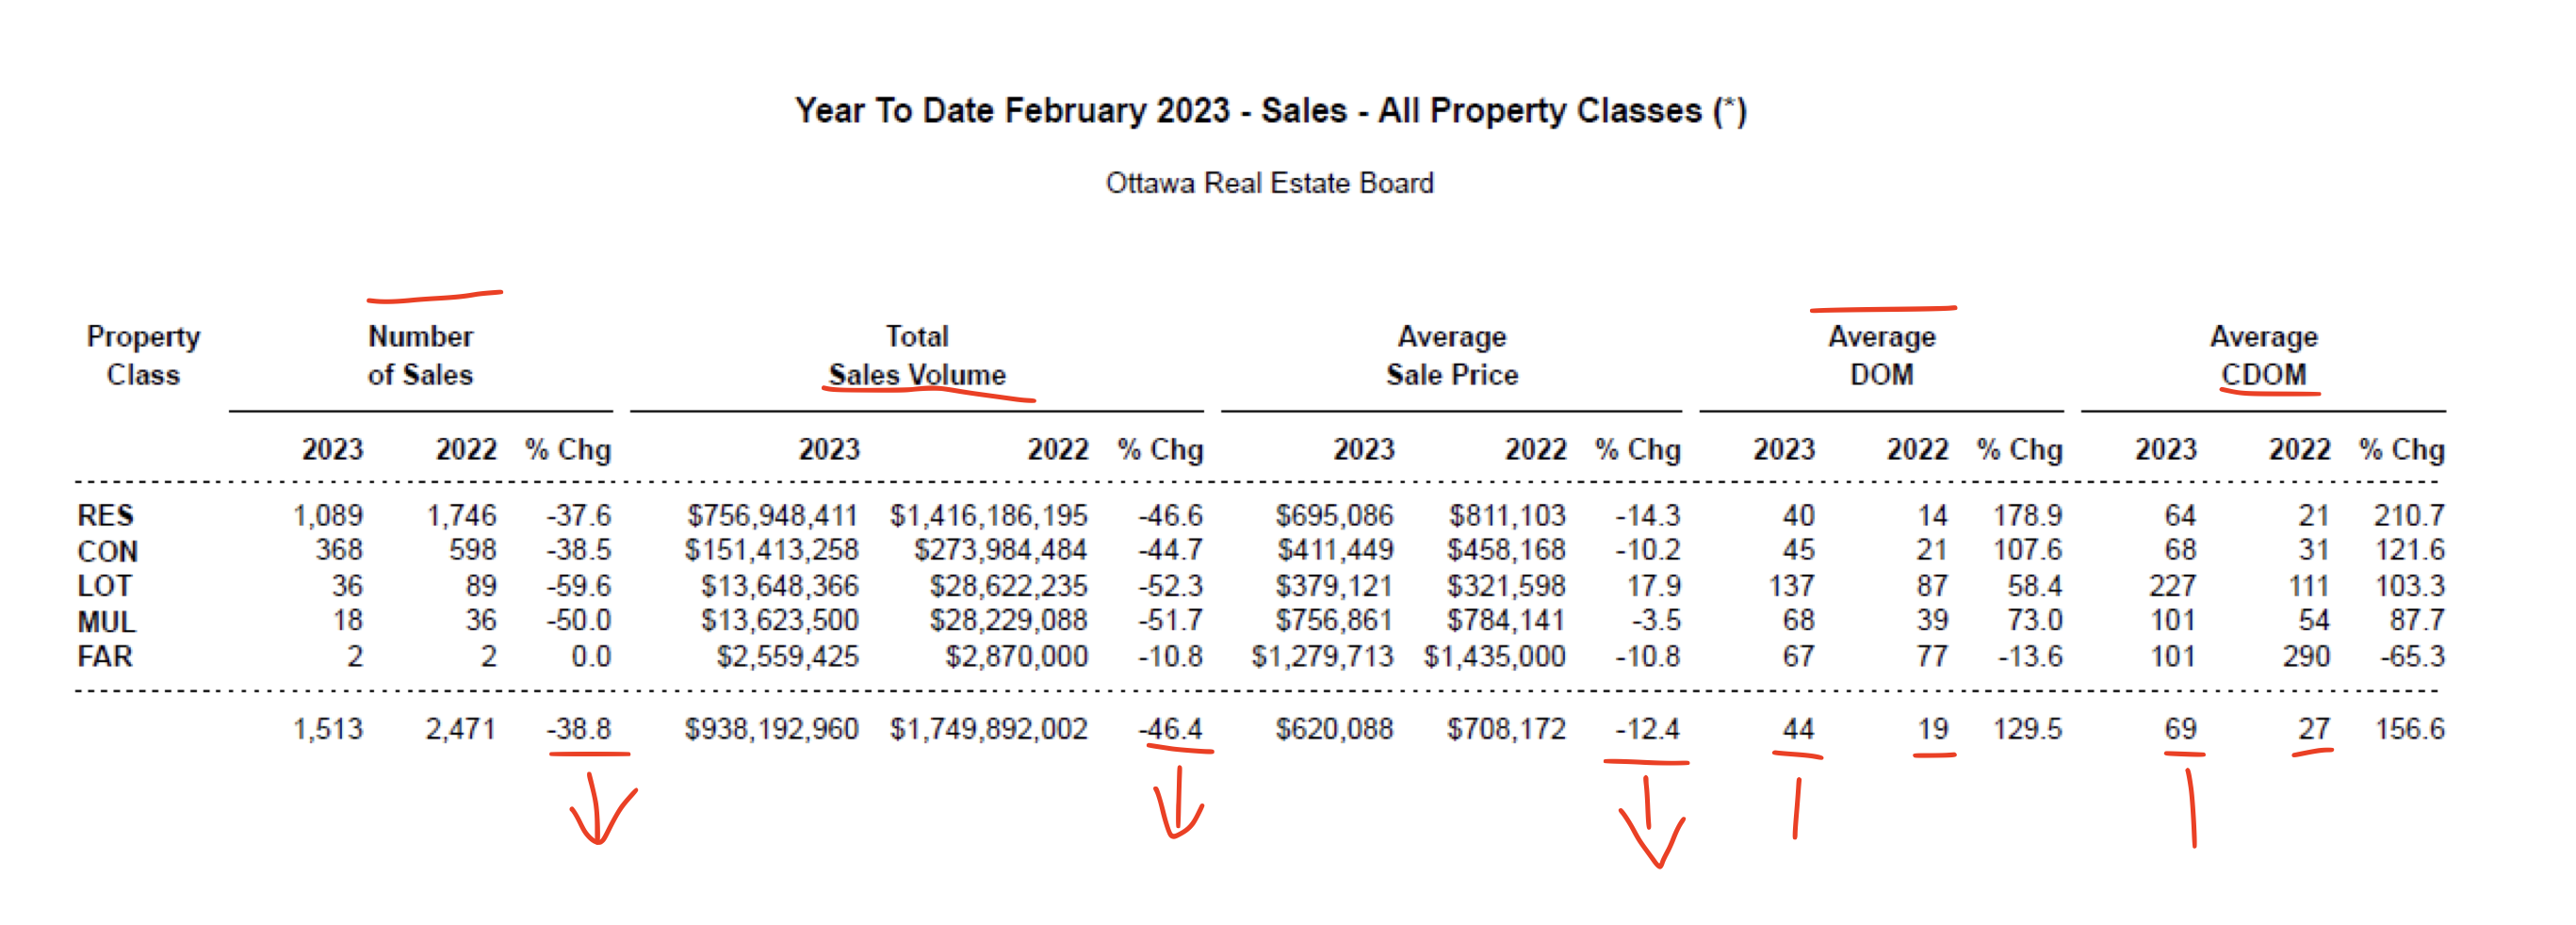
Average Sale Price February 2023= from $708,172 down to $620,088 (-12.4% down)
Quantity of sales: 2471 down to 1513 in Feb 2023 (-38% down)
CDOM= Re-listed : Days on Market from 27 to 69 days ( more days on market: +42 days)
DOM= Days on Market – from 19 days TO 44 days longer in 2023 ( more days on market: +25 days)


February 2023 – Resale Market Starts Slow as Buyers Remain Cautious
February 2, 2023
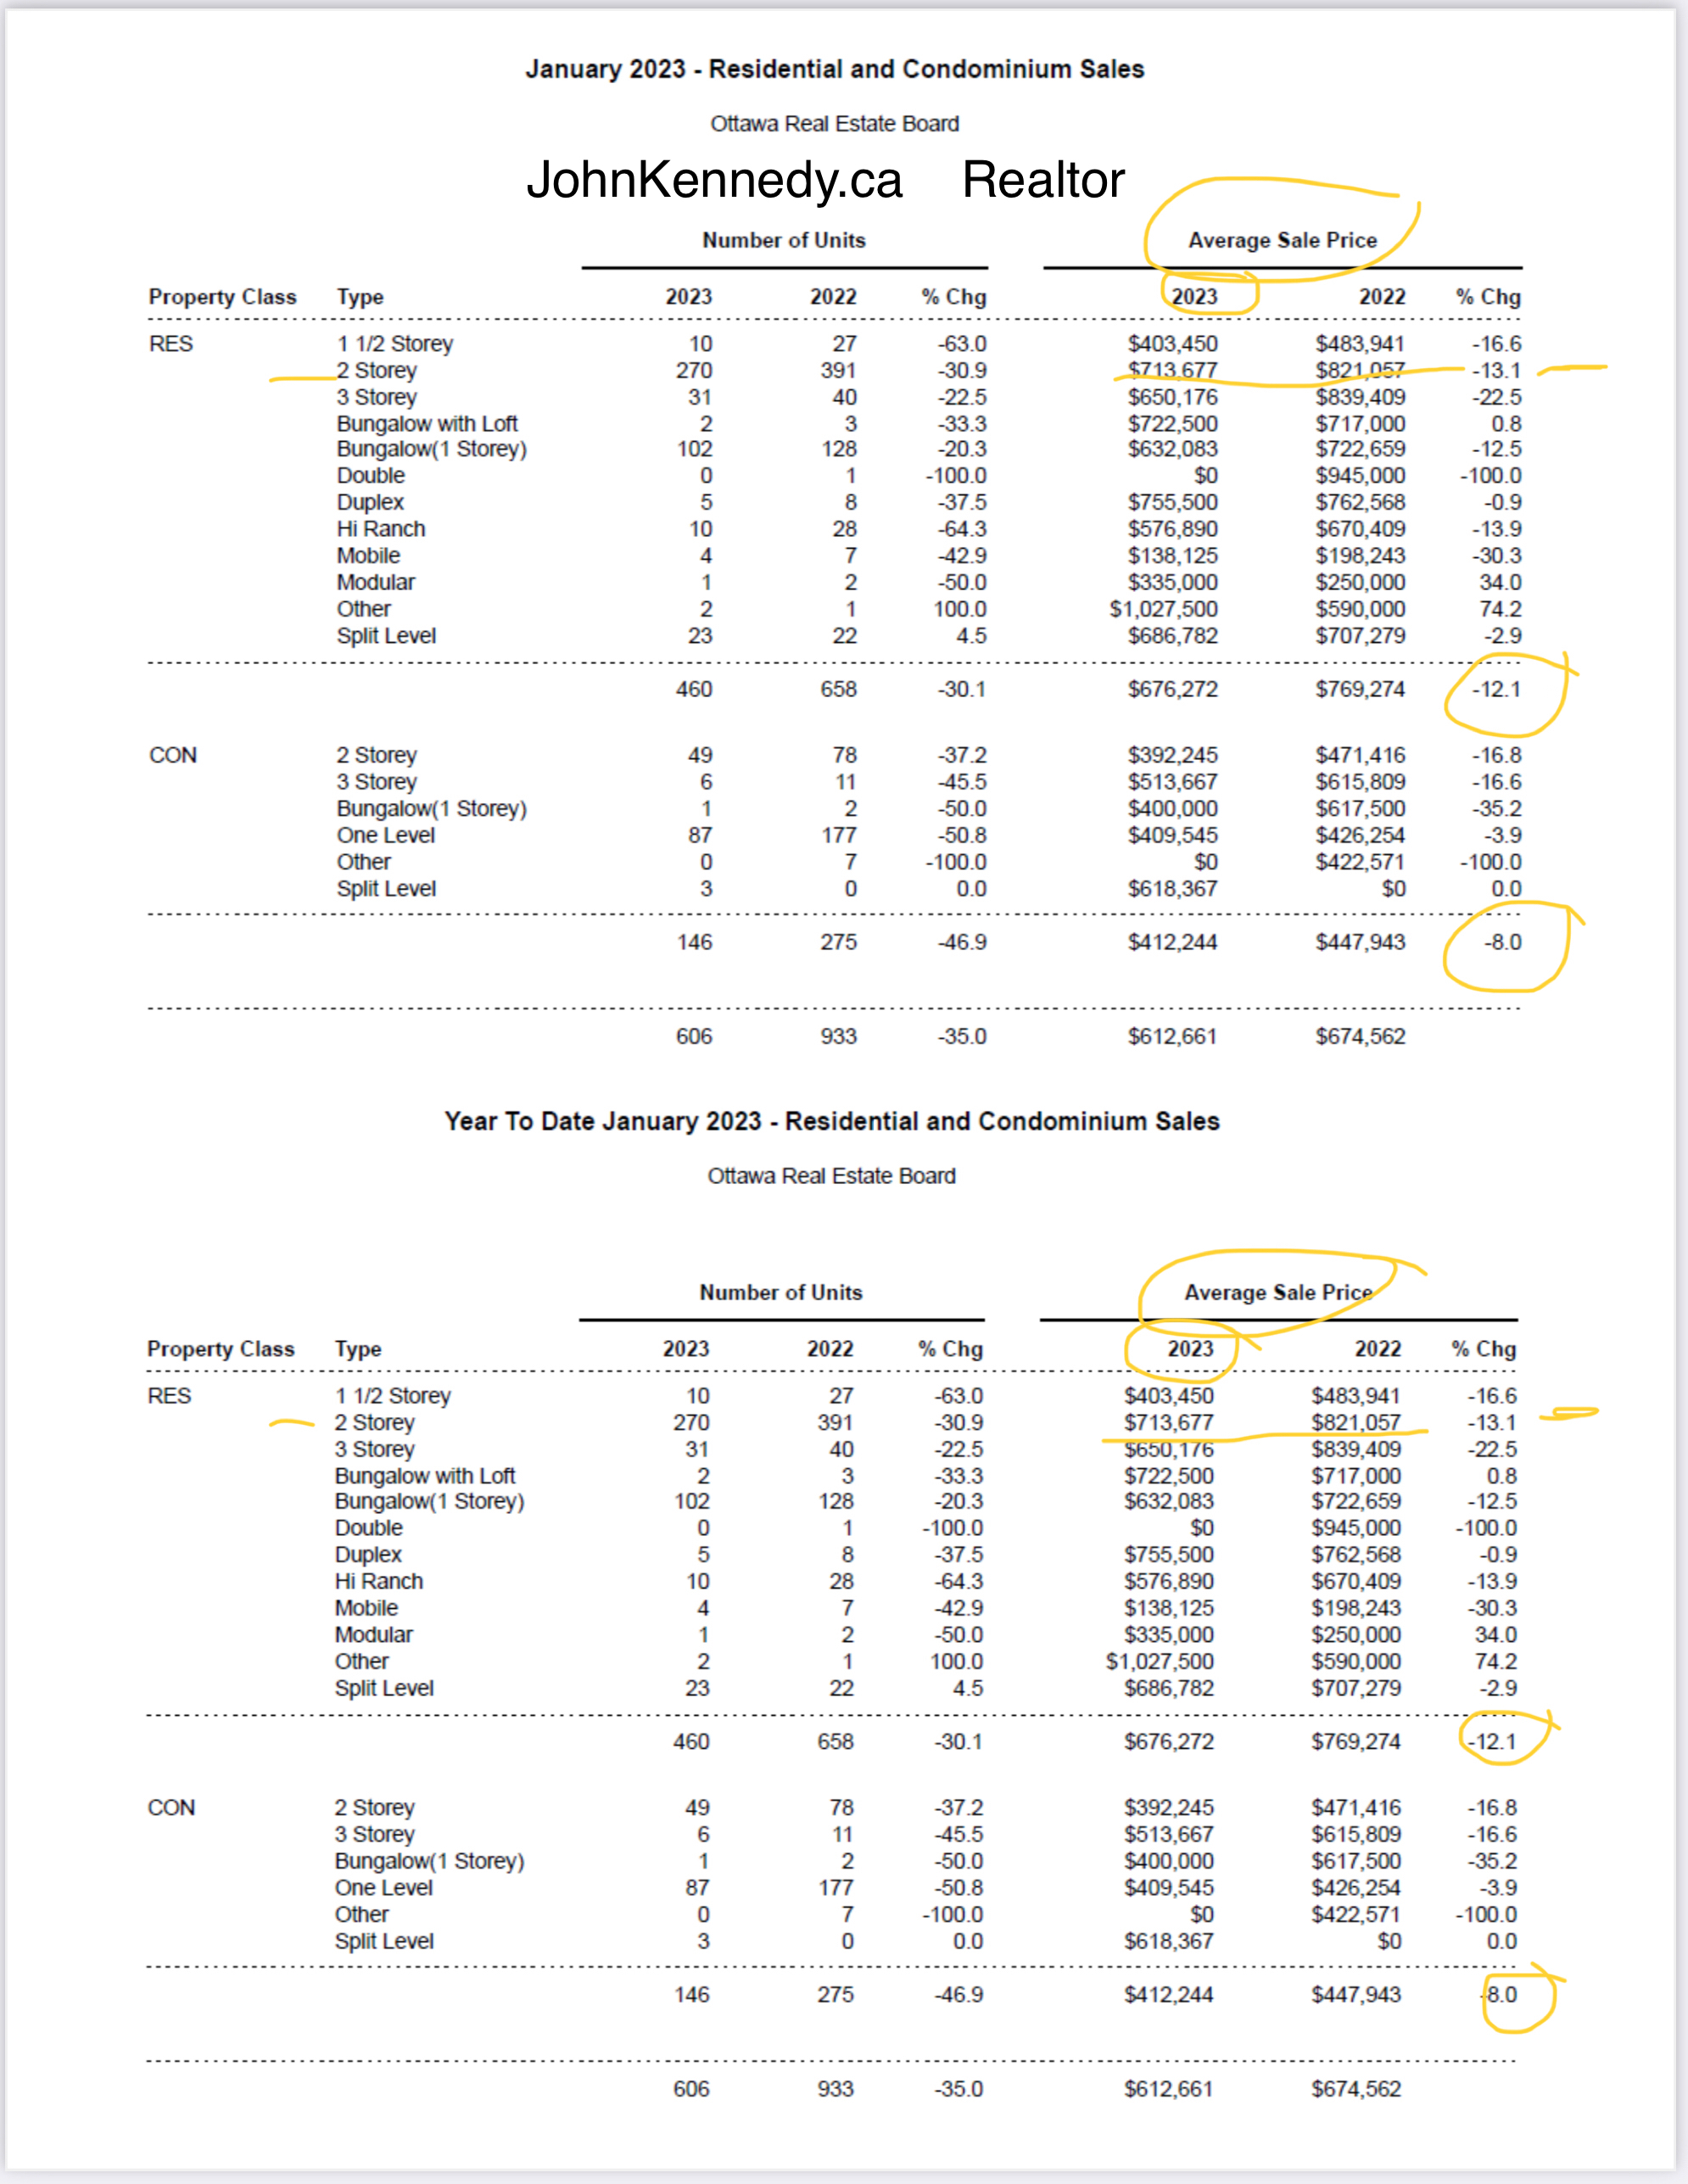
Members of the Ottawa Real Estate Board (OREB) sold 606 residential properties in January through the Board’s Multiple Listing Service® (MLS®) System, compared with 933 in January 2022, a decrease of 35%. January’s sales included 460 in the freehold-property class, down 30% from a year ago, and 146 in the condominium-property category, a decrease of 47% from January 2022. The five-year average for total unit sales in January is 819.
“January’s marked slow down in unit sales over 2022 indicates potential home buyers are taking their time,” says OREB President Ken Dekker. “While last month saw the culmination of the succession of interest rate hikes announced by the Bank of Canada, affordability remains a factor. They may be waiting for a shift in listing prices. They’re being cautious in uncertain conditions.”
By the Numbers – Average Prices*:
- The average sale price for a condominium-class property in January was $412,244, a decrease of 8% from 2022.
- The average sale price for a freehold-class property was $676,272, decreasing 12% from a year ago.
“Despite the decrease in average prices, the market should not be considered on a downward slide,” says Dekker. “A hyper COVID-19 seller’s market is now leveling out to our current balanced market state.”
“On a positive note, in comparison to December’s figures, January’s average price of freehold properties increased by 3%. The average price of condos did fall by 5% compared to December but condo pricing tends to fluctuate more due to the small data set.”
By the Numbers – Inventory & New Listings:
- Months of Inventory for the freehold-class properties has increased to 3.8 months from 0.9 months in January 2022.
- Months of Inventory for condominium-class properties has increased to 3.8 months from 0.8 months in January 2022.
- January’s new listings (1,324) were 16% higher than 2022 (1,142) and up 89% from December 2022 (699). The 5-year average for new listings in January is 1,233.
“Ottawa’s inventory and days on market figures are typical for a balanced market and another sign that buyers are no longer racing to put in an offer,” says Dekker. “The increase in new listings and supply is a boon for home buyers, who now have more selection and the ability to put in conditions at a less frantic pace. REALTORS® are an essential resource in finding the right property for the right buyer. On the other side of the transaction, REALTORS® can help sellers with hyper-local insights about how to sell in their neighbourhood at a time when pricing is key.”

More people are turning to REALTORS® for help renting properties — 509 this month compared to 410 in January 2022, an increase of 24%. “Even with the increase in housing stock, the tighter rental market is another indication that affordability is keeping some potential buyers on the sidelines.”
* OREB cautions that the average sale price can be useful in establishing trends over time but should not be used as an indicator that specific properties have increased or decreased in value. The calculation of the average sale price is based on the total dollar volume of all properties sold. Price will vary from neighbourhood to neighbourhood.
Market Prices Sold and Changes
2022 AWARD WINNER FOR SALES AND CUSTOMER SATISFACTION
Thank you for your trust and referrals!


Taking a closer look at Ottawa home prices for November 2022. Down -4.3%
As we take a closer look at these November 2022 Real Estate prices below and above. We are seeing a 2 storey home selling for less this month. Listing a higher price, but Selling Less. The average price has dropped to (-4.3%) and homes are staying longer on the market.
So let’s look even closer:
Year to date chart: November 2022 to November 2023 prices are UP +8.7% for that same average price on the same home. The way we are seeing things..is that more or less we are entering into a Normal Market +4%to 5% per year increases as per normal before 2015. Everyone at my brokerage thinks, home prices in Ottawa went up too aggressively and now the party is over in Toronto and now in Ottawa!
We don’t think Double digits profit and these aggressive increases per year in the Ottawa Real Estate market is a healthy market.
Lets talk a bit about supply:
New Homes Supply is still very low and will continue to create demand and that means you pay more. See Condos went up 9.3% this month because of affordability and a lack of homes. Over Supply of homes are also not good, and that was the case in the US HOUSING CRASH around 2008 it stalled or crashed most economies including Canada.
Construction and Renovation a difficult permit process.
I would say, we do need to get more homes constructed right now, and building a home should be made much much easier. But it seems today you need a University Degree to deal with the building departments for the Construction of a family home. Apparently my grandfather grade 8 education is no good in our times. With his hand drawings or ruler and pencil wouldn’t work today to get a permit and he constructed 100s of homes as a carpenter, and he had 9 children all educated and fed well. Some people can only afford 1 child. What is wrong with our system in 2022? It simply broken with greed and we are seeing life keeps getting more expensive, harder and more controls placed upon us. It’s impossible building a home or renovation for an apartment in your basement, or building a sons home at the back on your 5 acre land . Our permit system is designed to stop us from building homes. All construction approval is controlled by a few, just like oil.
Conclusion: How about if the city would design 5-10 home models (standard family homes) for you to chose from, free of charge and ready to go, engineered stamped and approved drawings, with all technical drawing stamped for insurance. All designed and Ready for a person to build his/her home on a piece of land. Wouldn’t that be cheaper for the citizen and our kids to build a home? Wouldn’t that ready to go models stop all this red tape, delays, paperwork dance, back and forth approval drawings, months of planning? Just my thoughts on helping people get a home faster! I also think the government should be more involved in the home building for its citizens in 2022 as many developing countries do and since we all now know we have a supply problem.
Did you know: In the last 10 years Builders were only releasing to build a few homes at a time, and selling them in an Auction Sales day Now!! 10 homes for a 100 buyer and you bid. First release Sales day! Prices will continue to climb aggressively if we don’t address these lack of new home supply issues soon. That’s just my thoughts.
Have a super month and remember investing in a property is always a good investment. Ask your parents what they paid for a home and see the future prices unfold.
Investment and opportunity
Let me help you to Build family Wealth in Real Estate. Join me one evening and let me show you where to invest in Real Estate for a wealthier family future.
Contact me anytime,
John

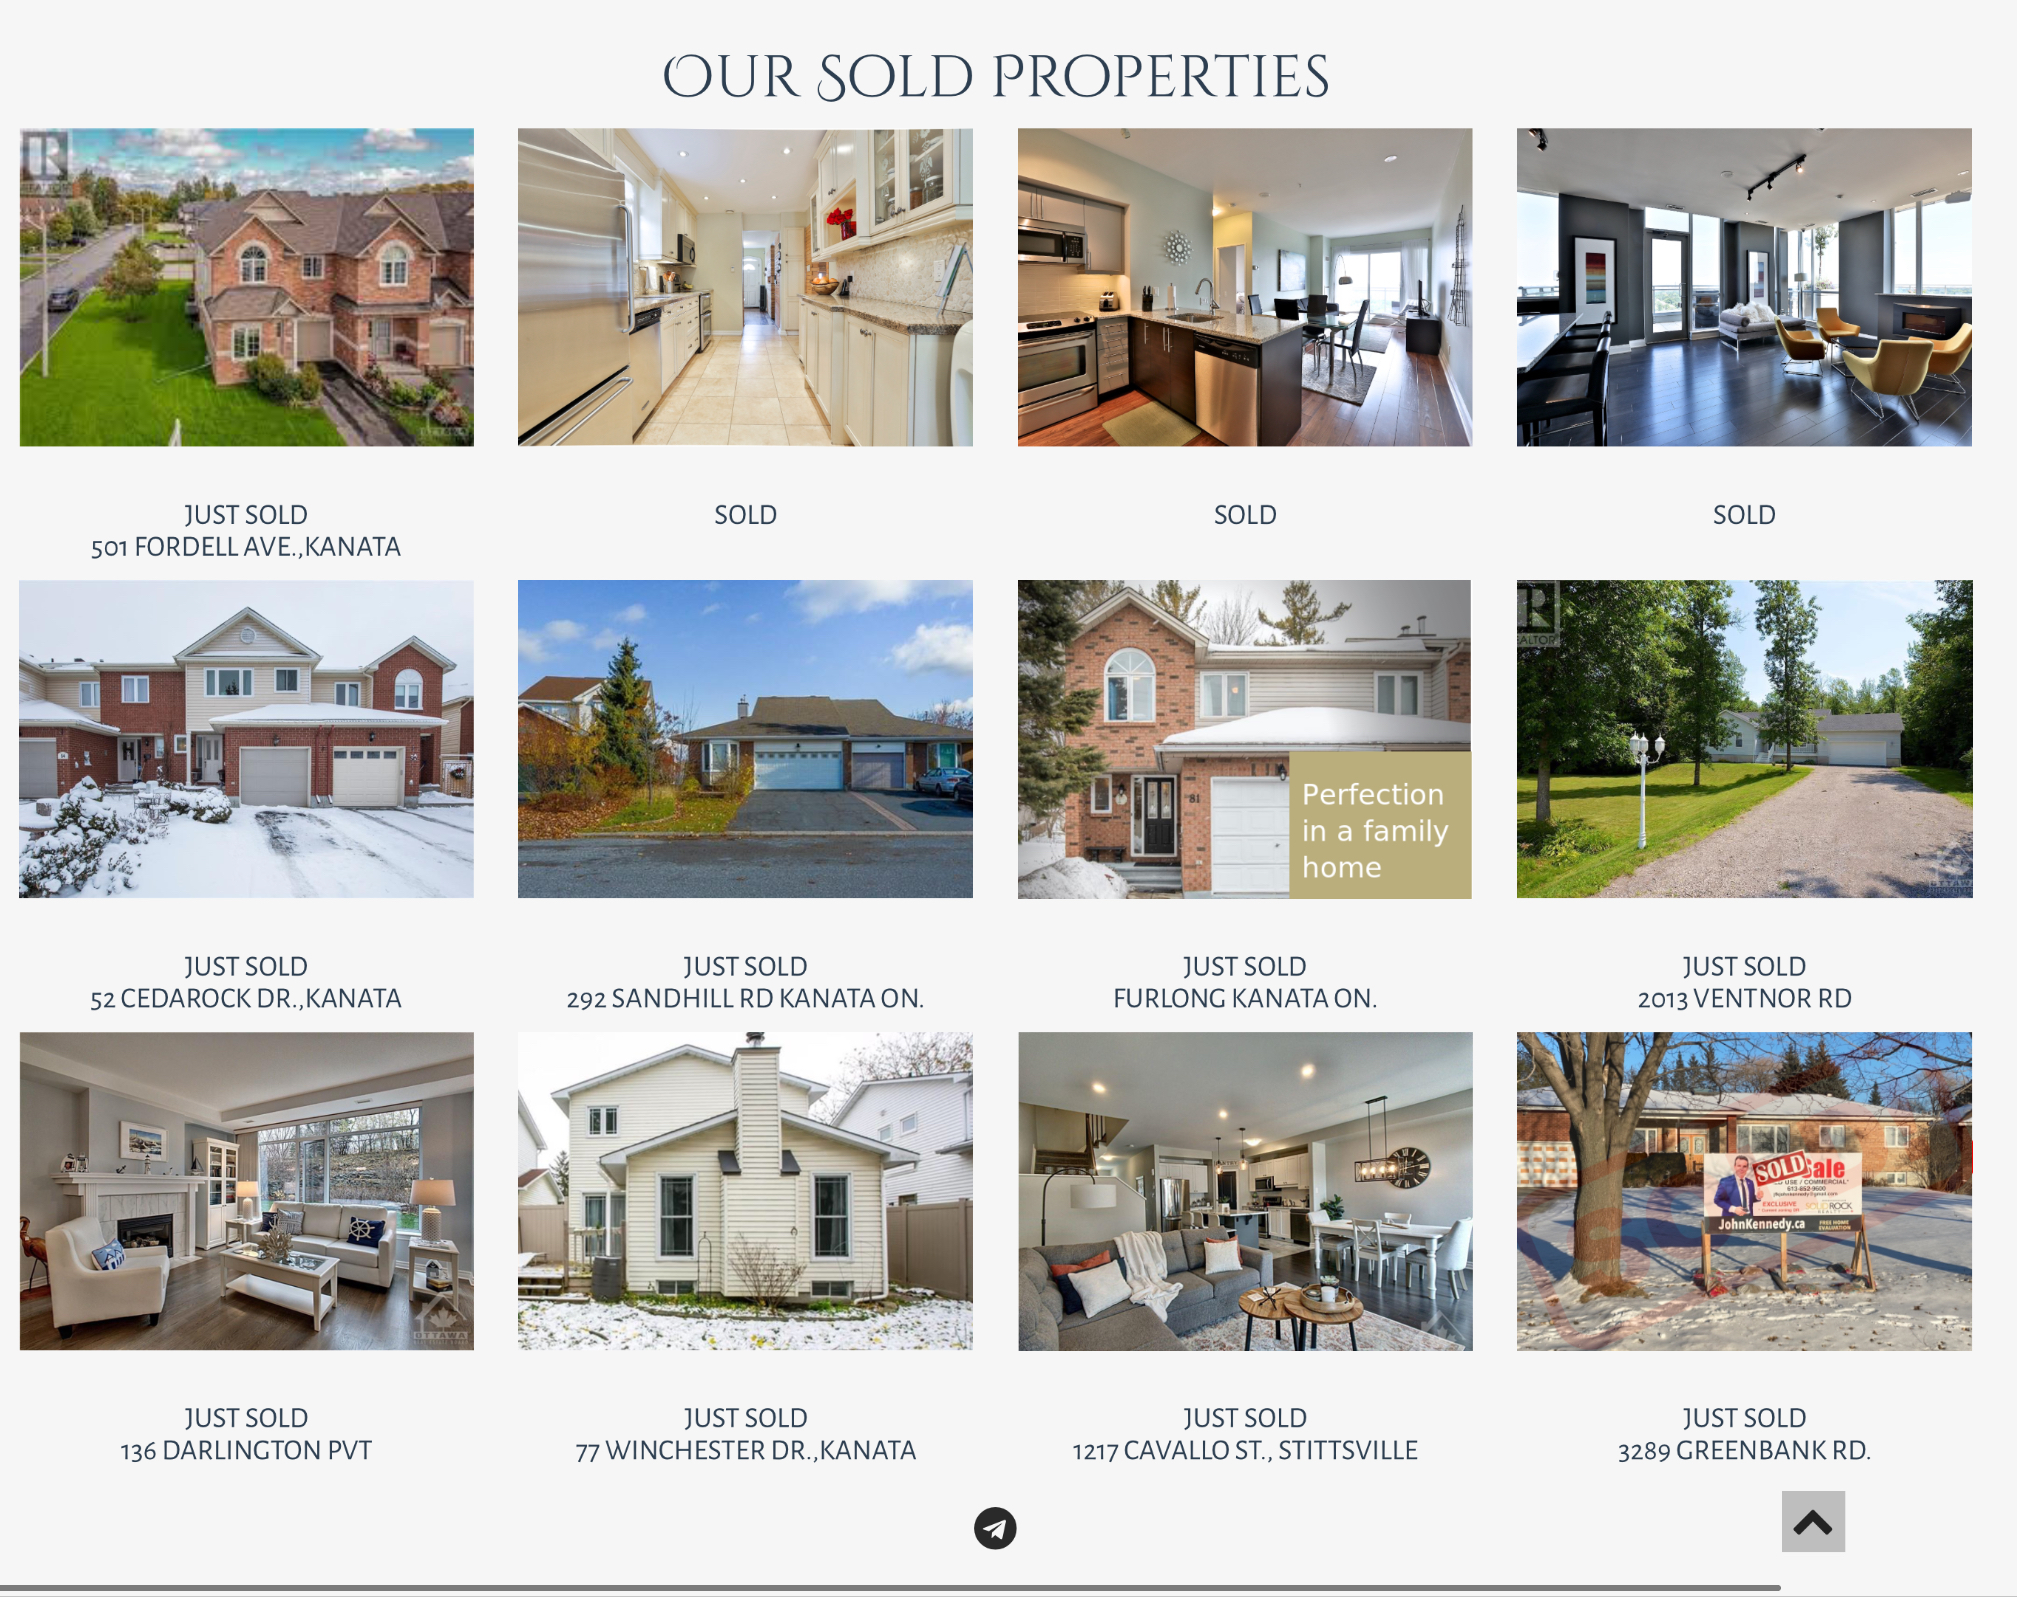
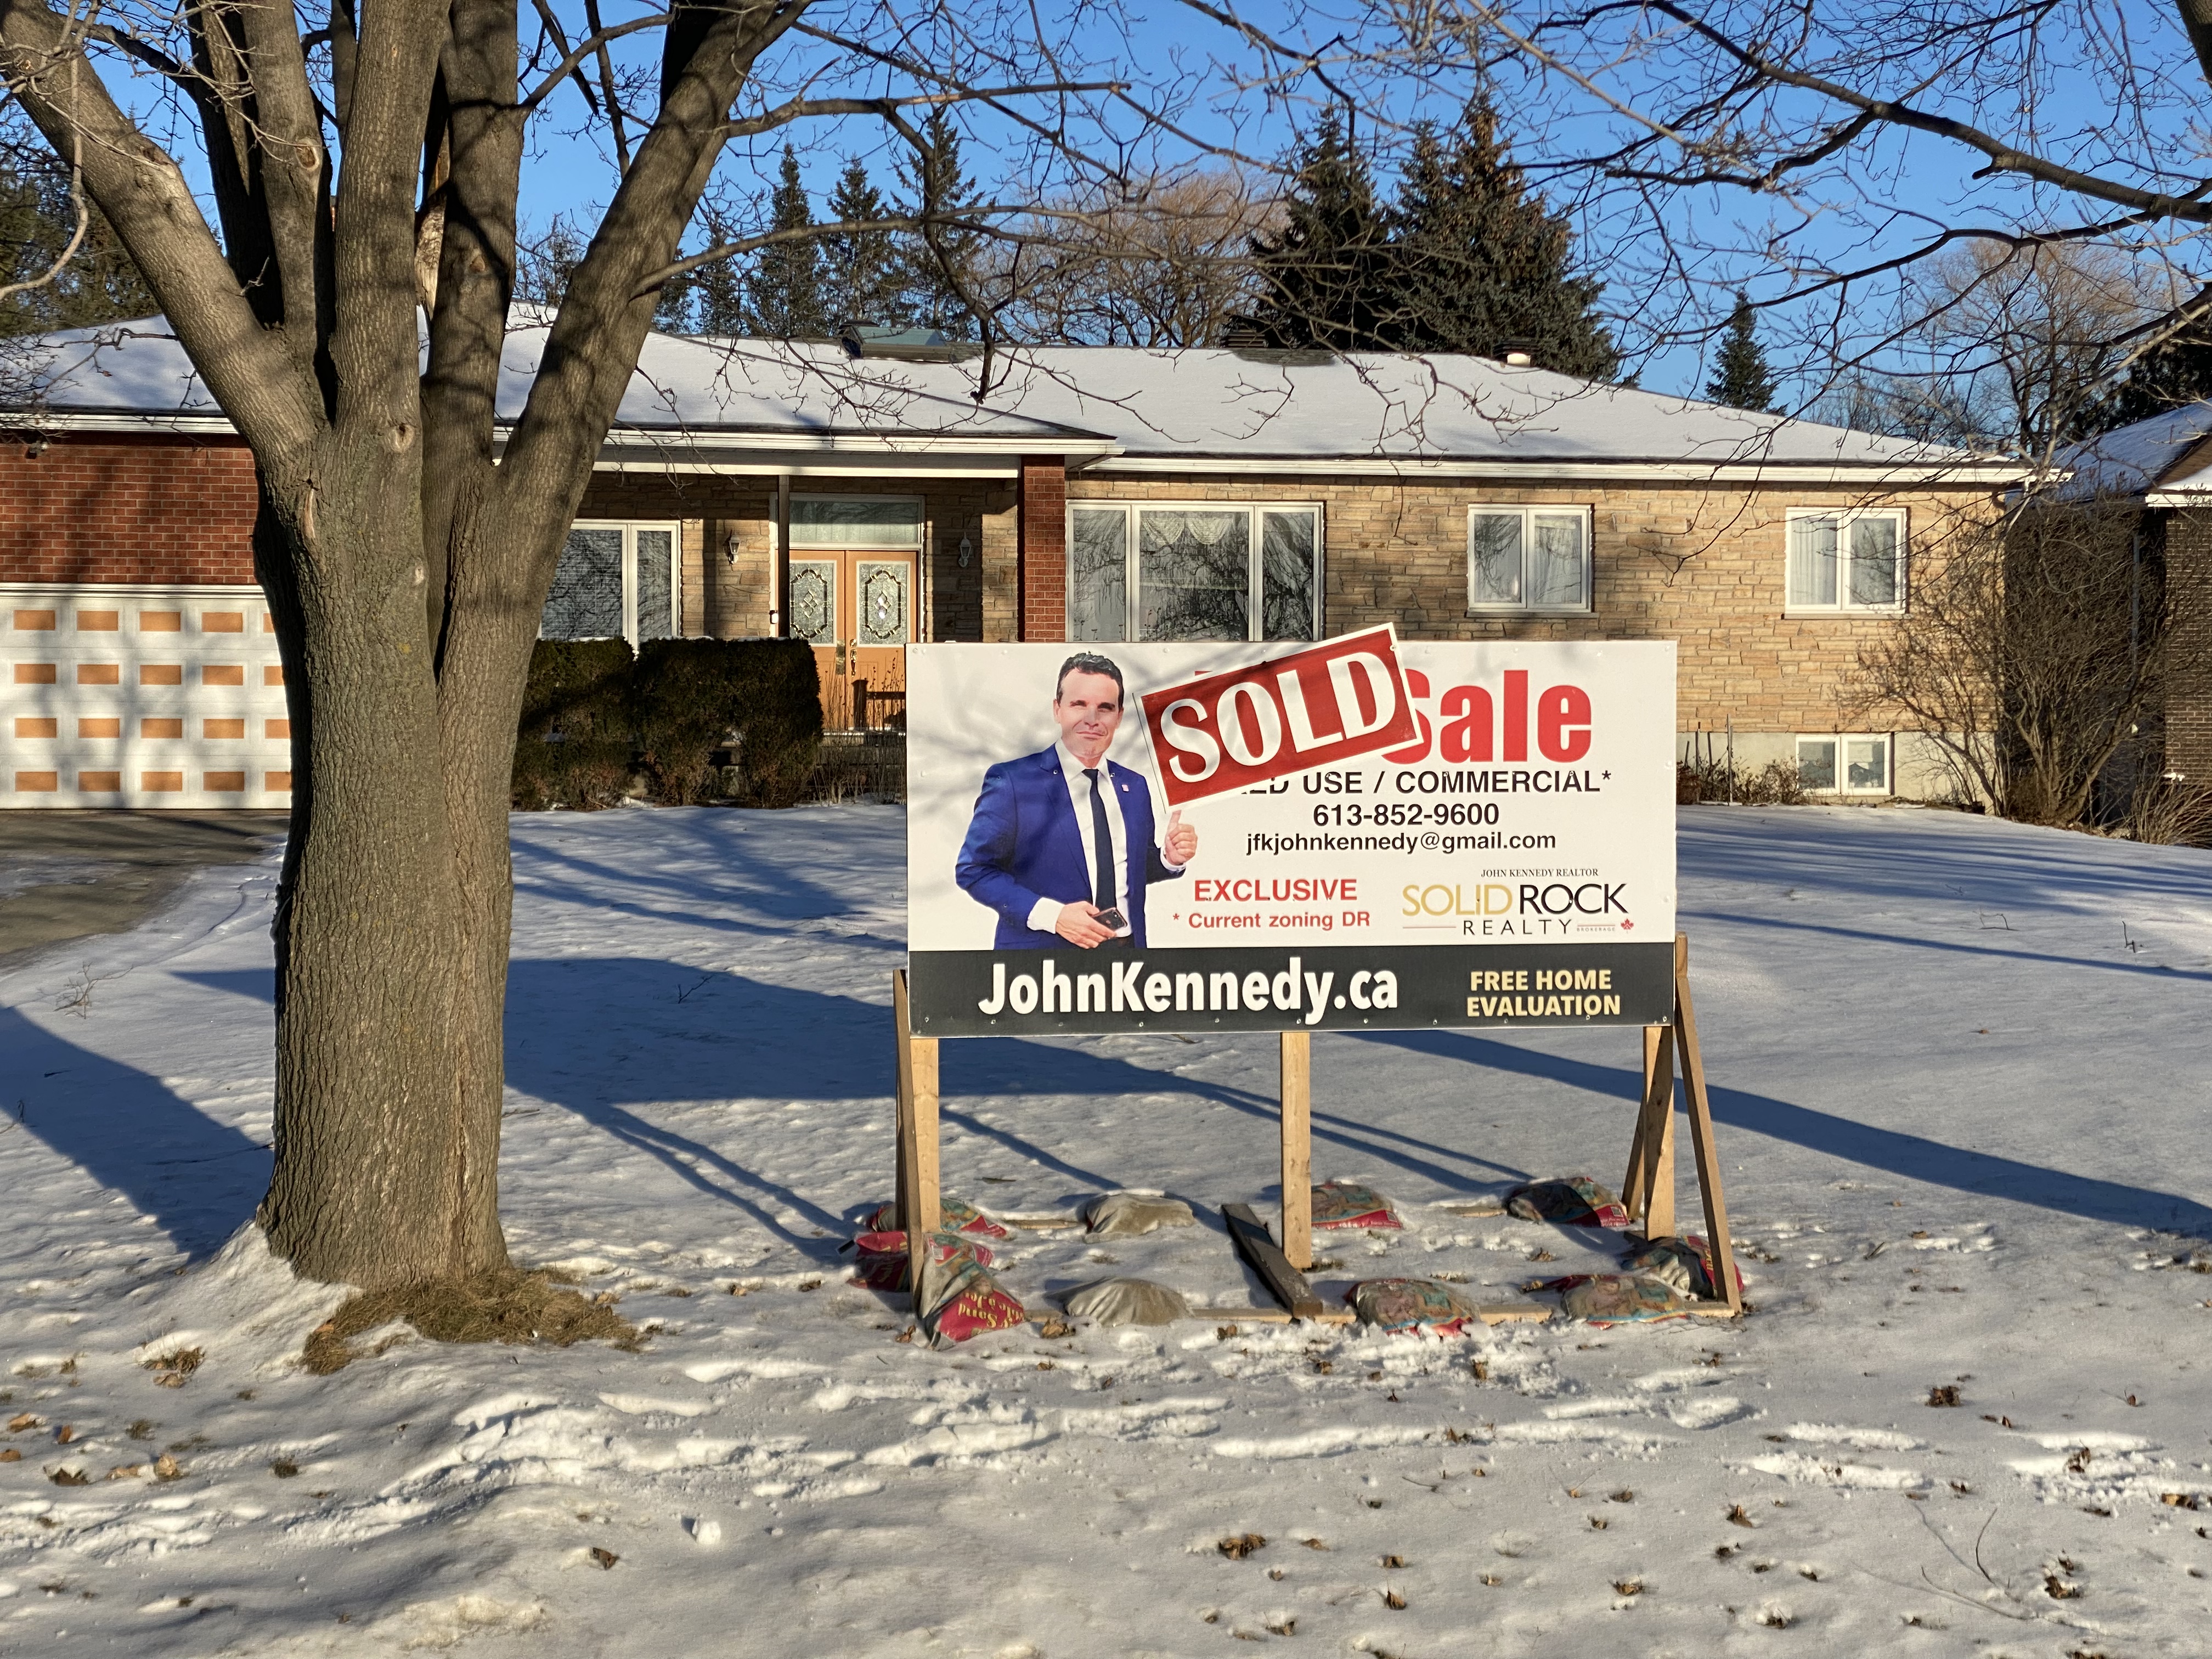
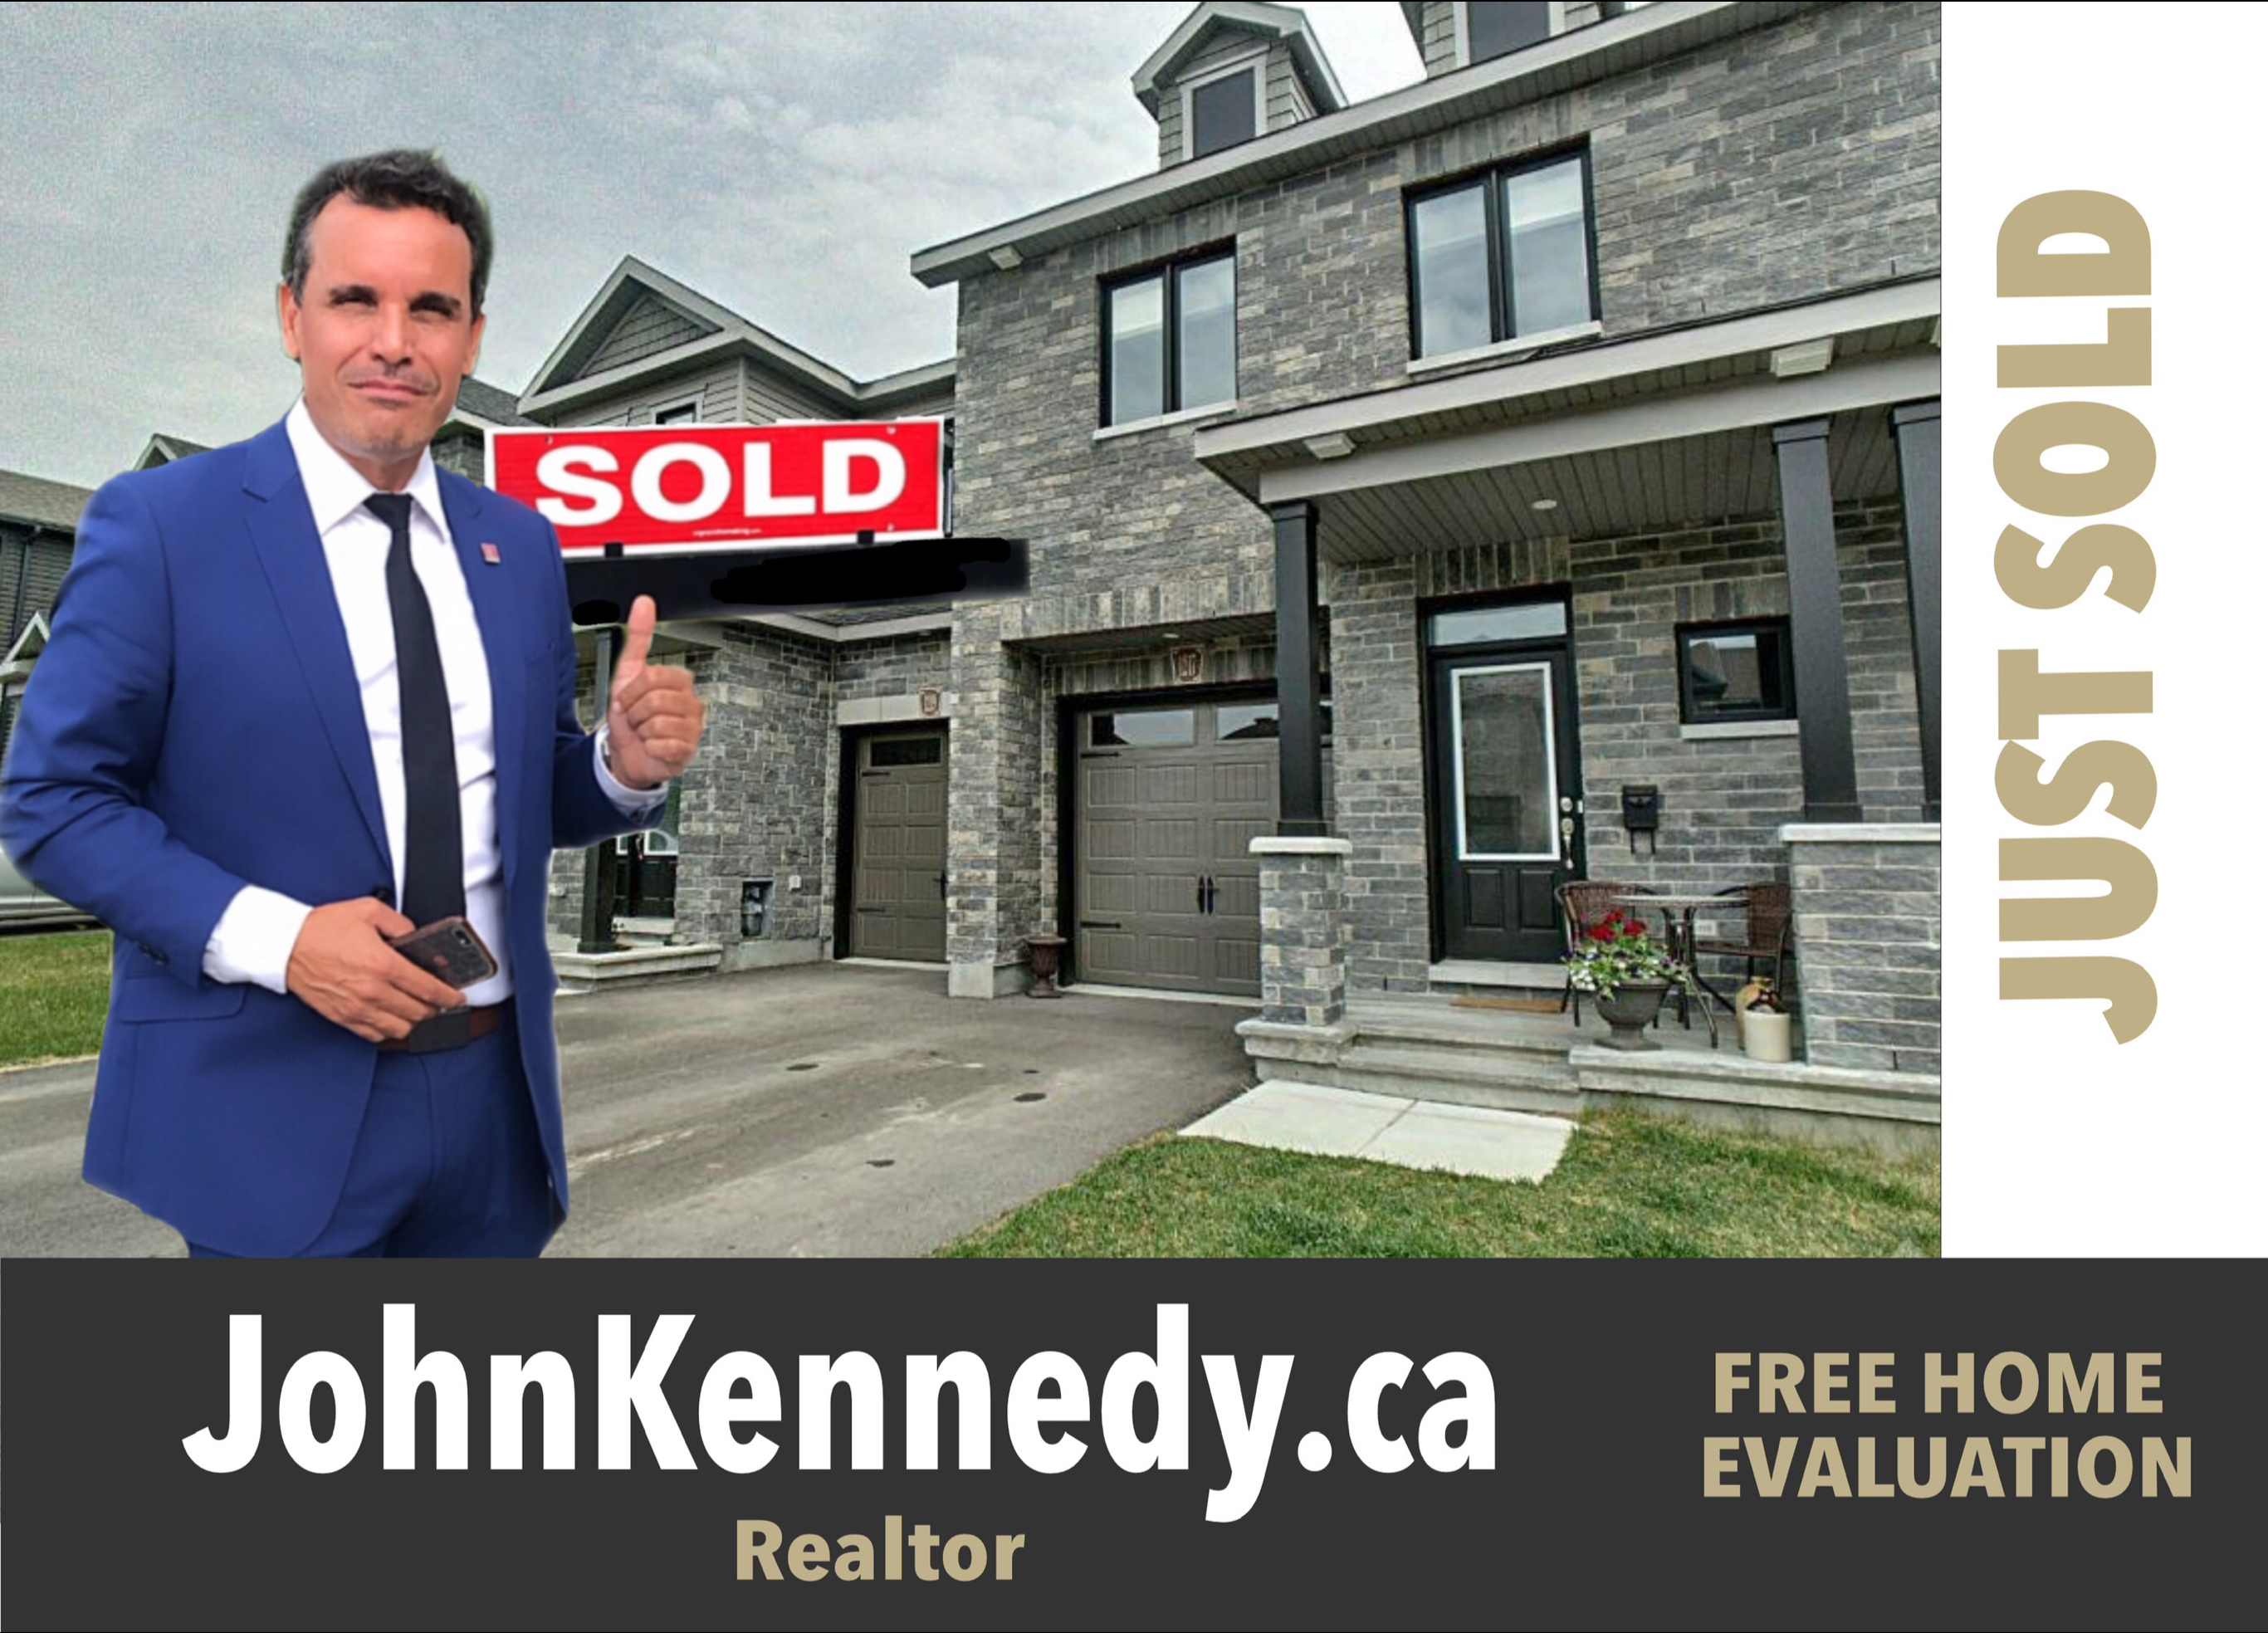
Just Sold
#barrhavenhomesforsale
#kanatahomesforsale
#ottawahomesforsale
#2022homepricesottawa

HOMES-FOR-SALE-OTTAWA – KANATA-HOMES-KANATA-OTTAWA HOMES FOR SALE – OTTAWA HOME PRICES SEPTEMBER 2022- OTTAWA CONDOS FOR SALE SEPTEMBER 2022 – LATEST OTTAWA REAL ESTATE NEWS.
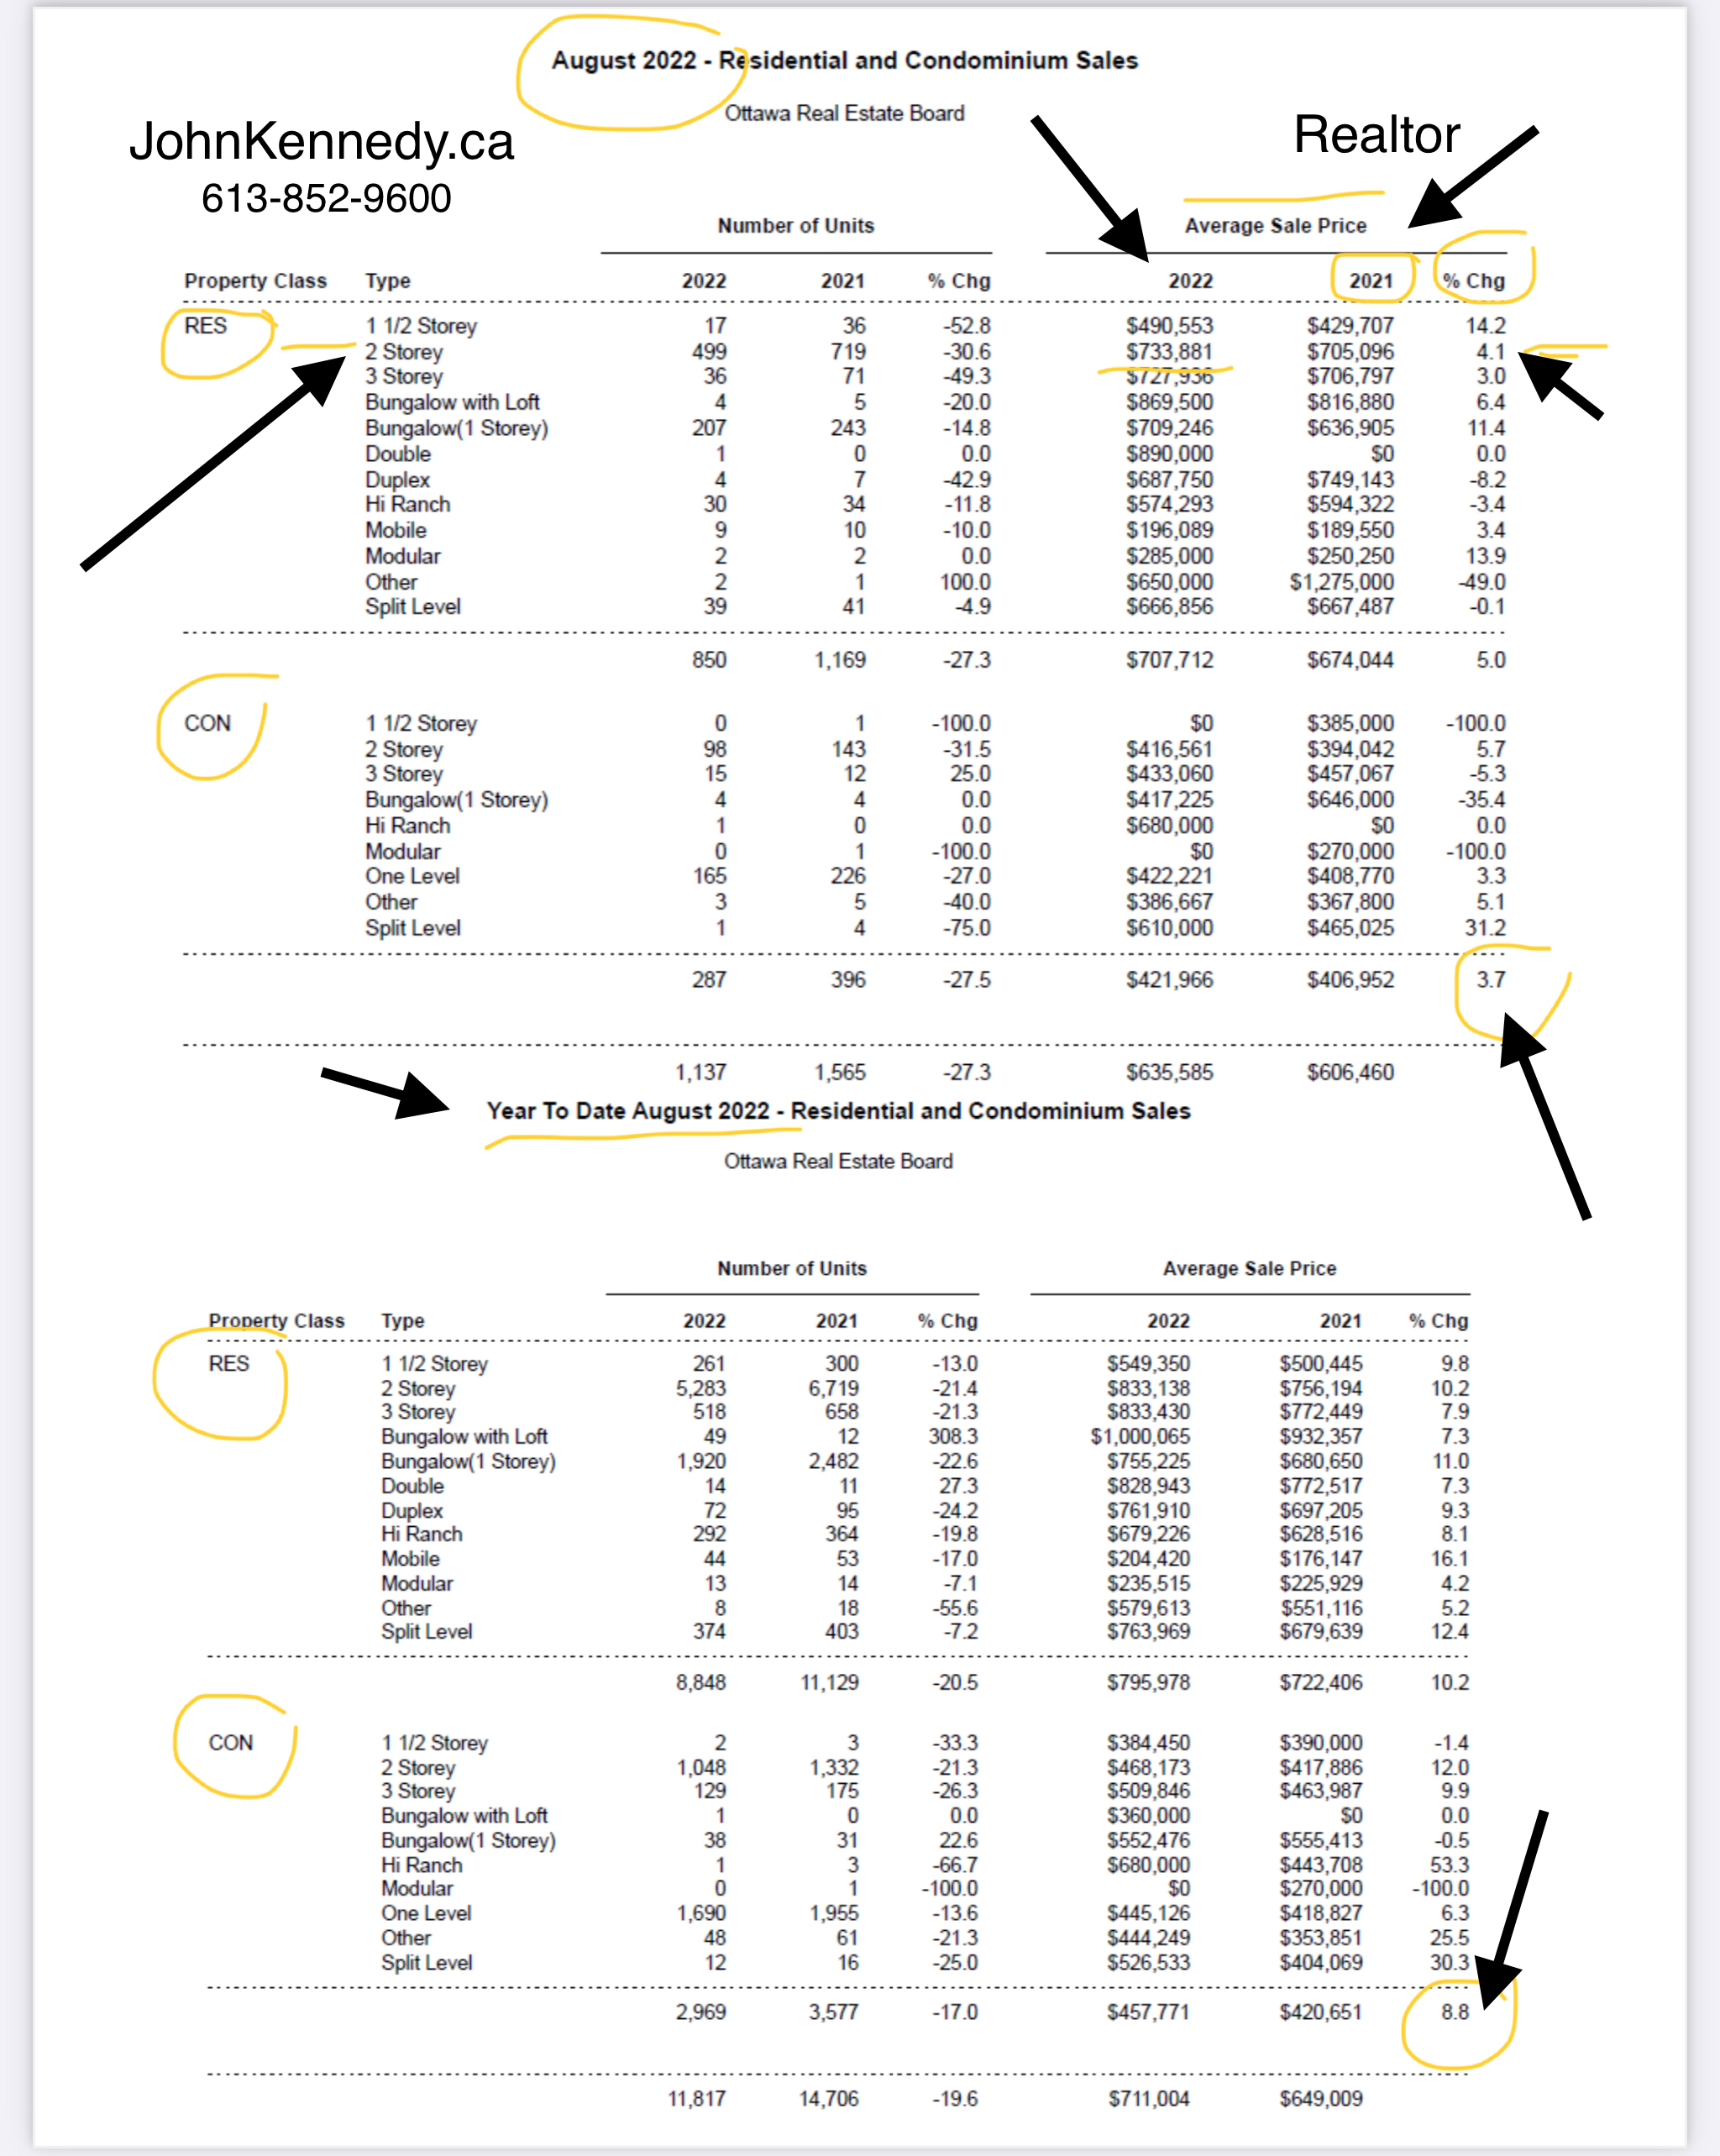
Buyer Uncertainty Slows Down August Resale numbers.
But Prices are still up in Residential homes 10.2% and Condominium 8.8% from last year August .
September 6, 2022, Update from the Ottawa Real Estate Board.
September 6, 2022
Members of the Ottawa Real Estate Board sold 1,137 residential properties in August through the Board’s Multiple Listing Service® System, compared with 1,565 in August 2021, a decrease of 27 per cent. August’s sales included 850 in the residential-property class, down 27 per cent from a year ago, and 287 in the condominium-property category, a decrease of 28 per cent from August 2021. The five-year average for total unit sales in August is 1,603.
“August is a traditionally slower month in Ottawa’s resale market ebb and flow cycle due to summer vacations. Compounding the slowdown in market activity, Buyers are uncertain about their purchasing power given impending additional interest rate hikes,” states Ottawa Real Estate Board President Penny Torontow.
“The lightning speed at which homes were selling at the start of 2022 is a thing of the past, evidenced by Days on Market (DOMs) inching closer to that 30-day mark. We have also observed a return to standard financing and inspection conditions and fewer multiple offer scenarios,” she adds.
Additional figures:
- The average sale price for a condominium-class property in August was $421,966, an increase of 4 per cent from 2021.
- The average sale price for a residential-class property was $707,712, increasing 5 per cent from a year ago.
- With year-to-date average sale prices at $795,978 for residential and $457,771 for condominiums, these values represent a 10 per cent and 9 percent increase over 2021, respectively.*
- 2,093 properties were listed in August, boosting inventory to nearly 3 months for residential class properties and 2.2 months for condominiums.
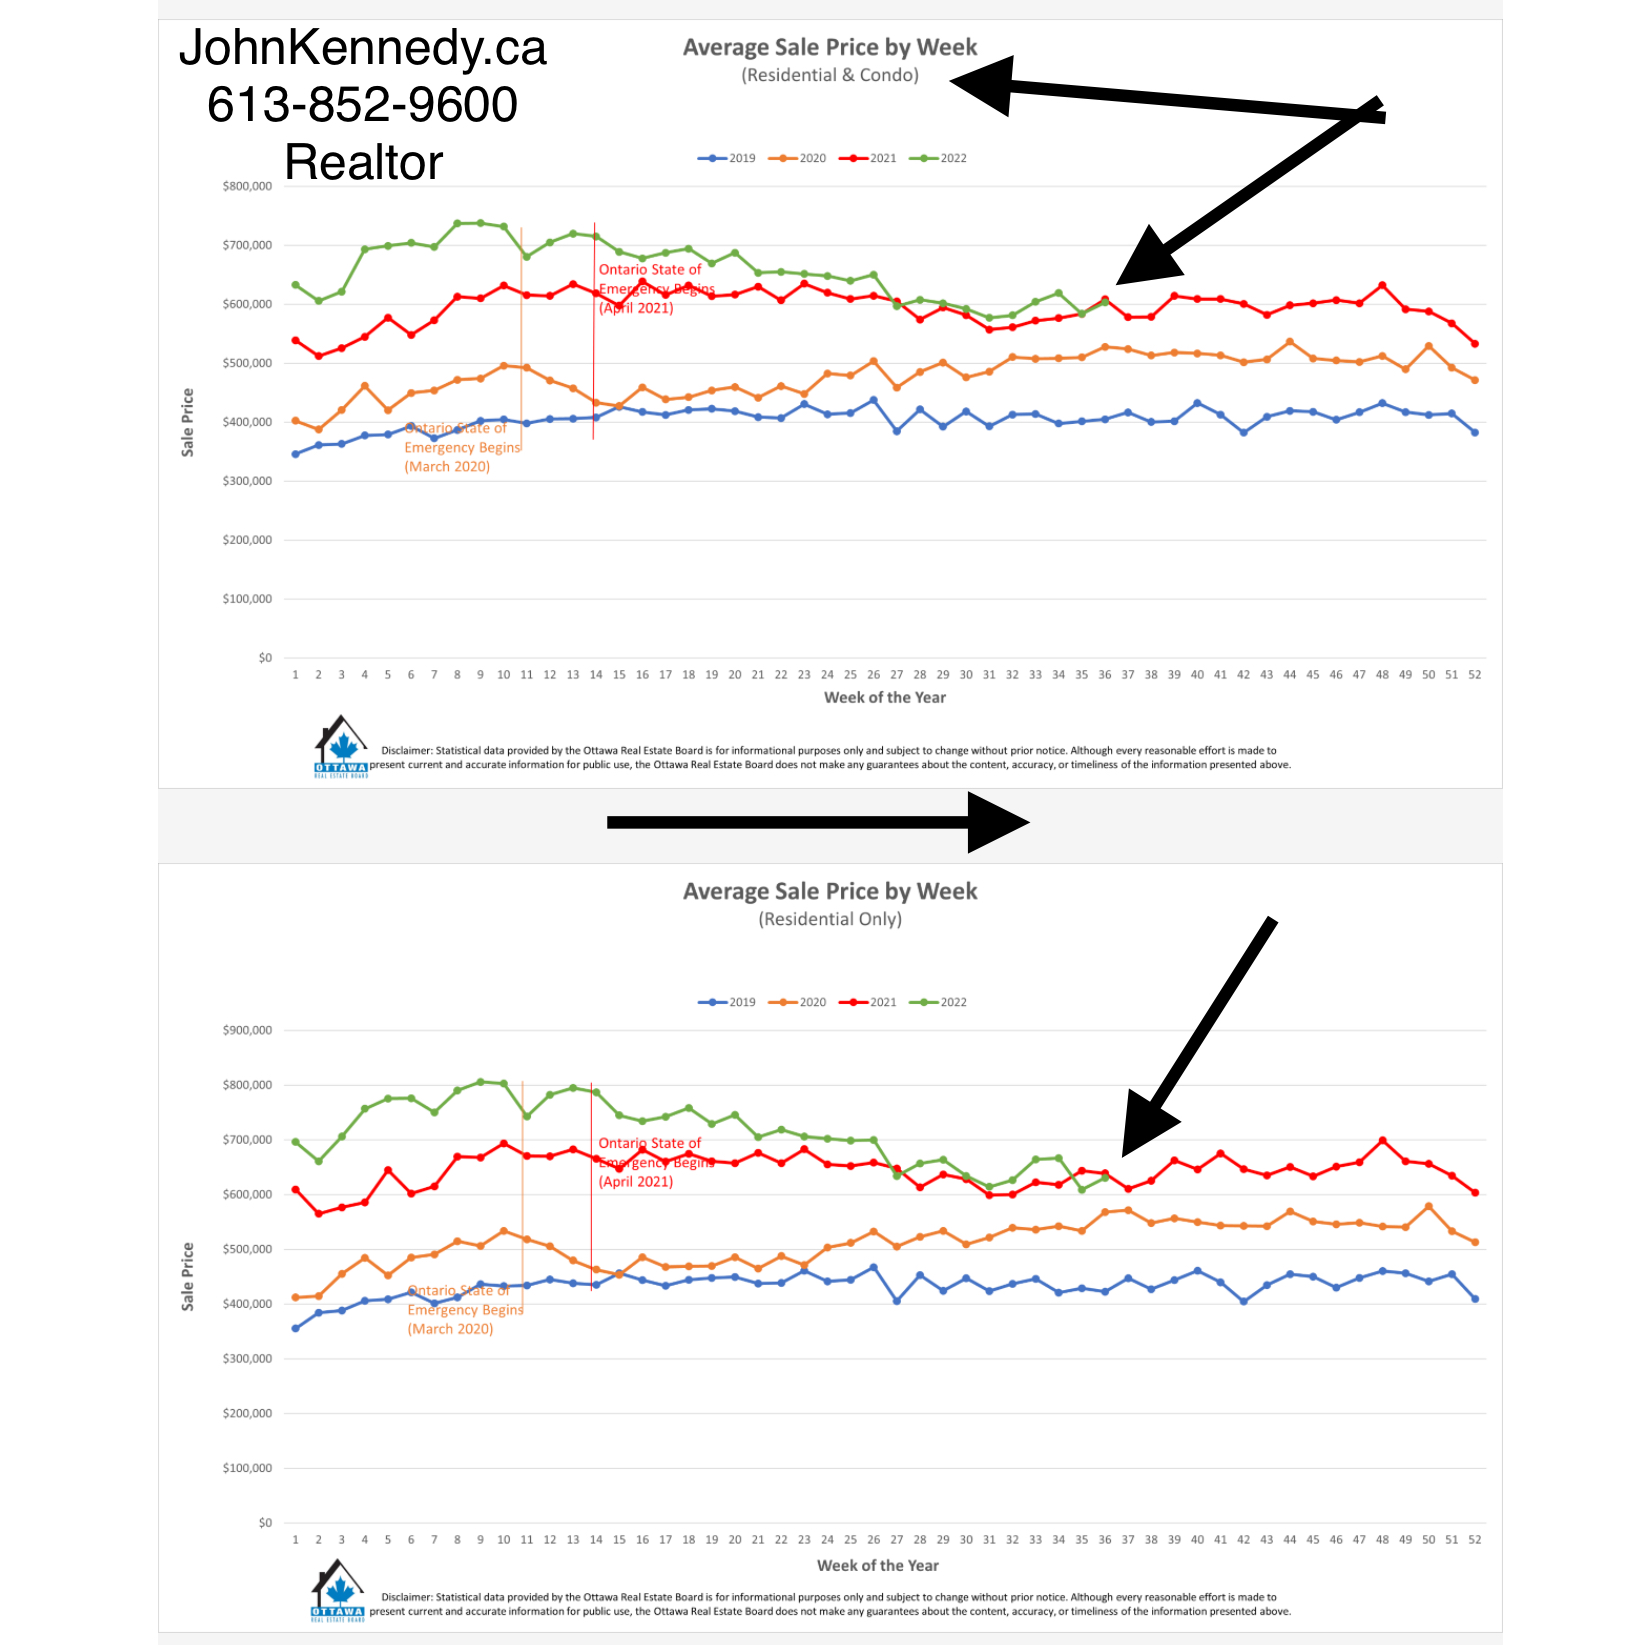
“Prices are still rising slightly in some areas, albeit lower single-digit percentage increases, bringing back the moderate price-growth stability that is characteristic of the Ottawa resale market. What happened to prices in 2020 and 2021 was unusual. We are moving towards a balanced market state, where Buyers have choices and Sellers need to ensure they are pricing their properties accurately,” Torontow advises.
“The informed market knowledge and insight of a licensed REALTOR® is critical to both Buyers and Sellers navigating market shifts. Sellers will want to closely explore with their REALTOR® the best time and price to list their home to optimize a property’s days on market. Buyers can use the extra time to work with their REALTOR® on due diligence and finding a dream home that meets their needs within their financial parameters.”
REALTORS® also help with finding rentals and vetting potential tenants. Since the beginning of the year, OREB Members have assisted clients with renting 4,172 properties compared to 3,182 last year at this time.
* OREB cautions that the average sale price can be useful in establishing trends over time but should not be used as an indicator that specific properties have increased or decreased in value. The calculation of the average sale price is based on the total dollar volume of all properties sold. Price will vary from neighbourhood to neighbourhood.
source OREB.
HOMES-FOR-SALE-OTTAWA – KANATA-HOMES-KANATA-OTTAWA HOMES FOR SALE – OTTAWA HOME PRICES FEBRUARY 2022- OTTAWA CONDOS FOR SALE 2022 – LATEST OTTAWA REAL ESTATE NEWS.
JUST SOLD
HOW MUST IS MY HOME WORTH?

AVERAGE MOVING PRICE SEPTEMBER 2022
JUST SOLD
HOW MUST IS MY HOME WORTH?
OTTAWA AVERAGE PRICES FROM SEPTEMBER 2022
RECEIVE FREE PROFESSIONAL ADVICE BEFORE YOU BUY OR SELL.
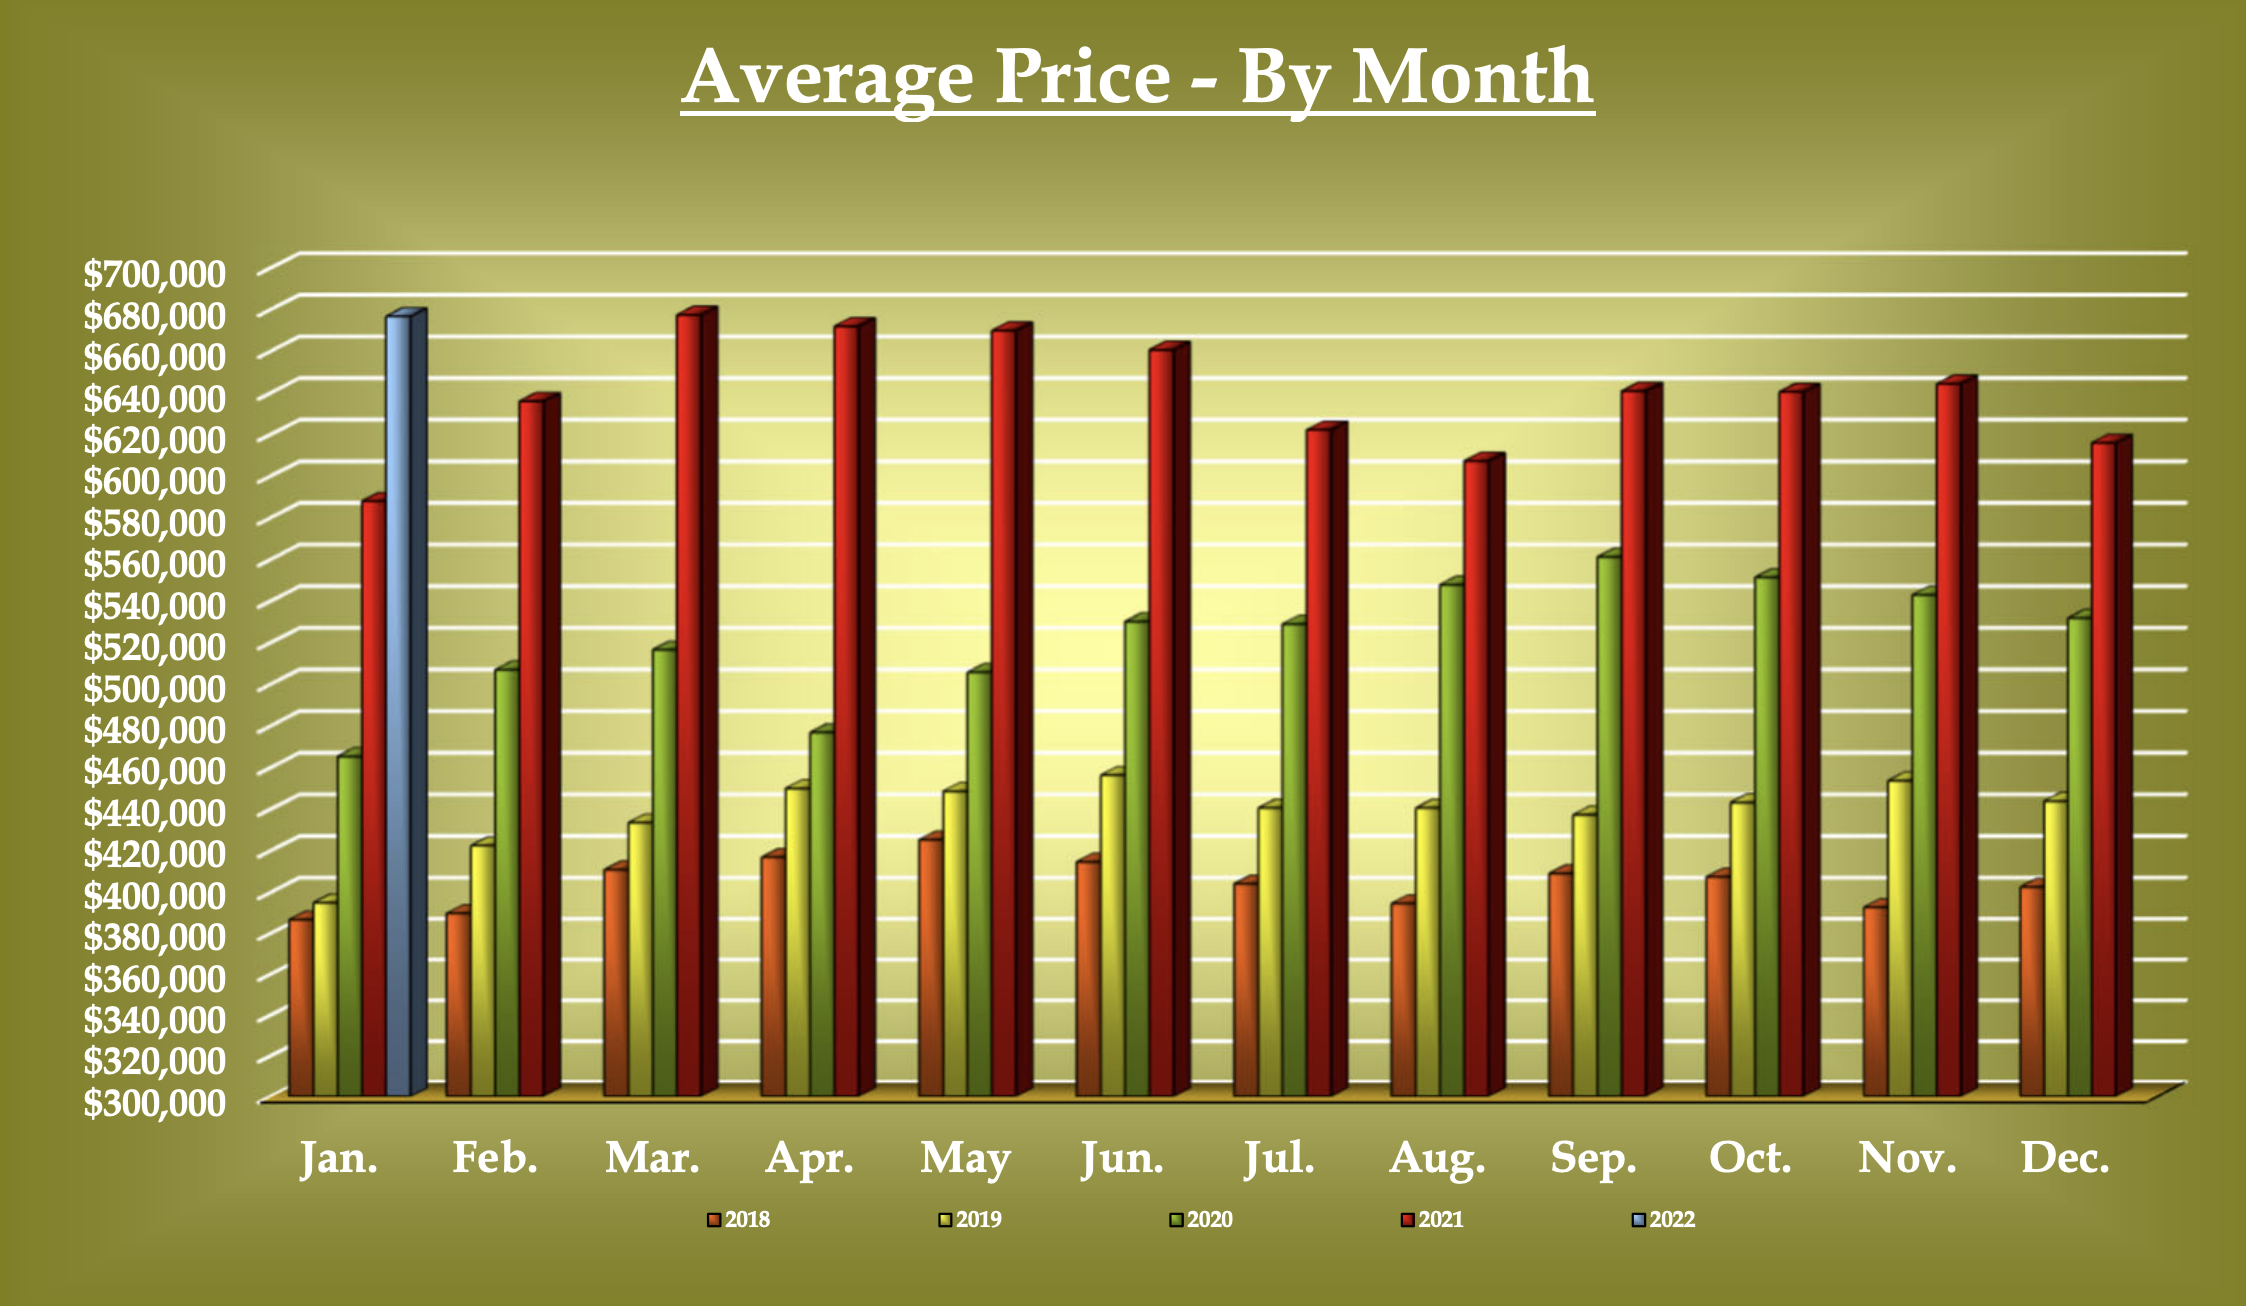
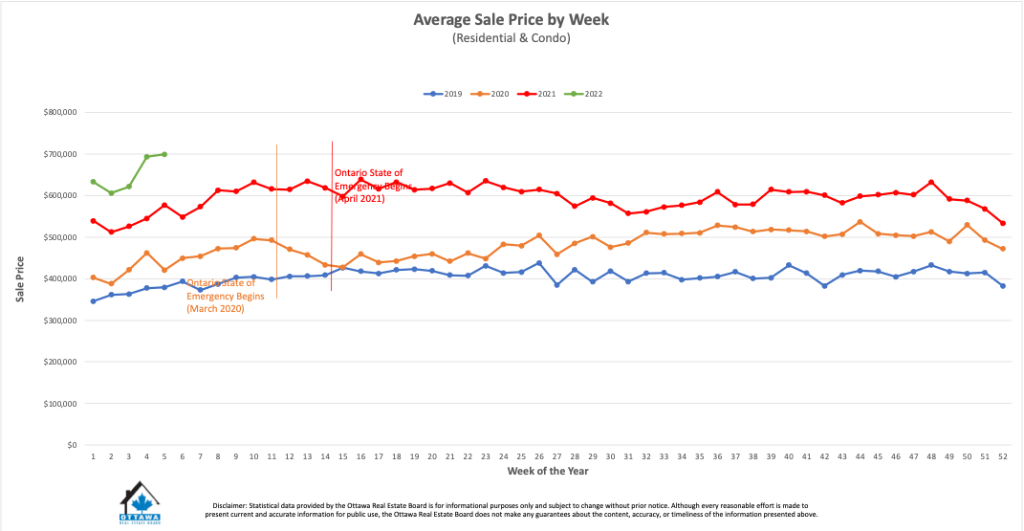
AVERAGE PRICE CHANGES BY MONTH

HOMES-FOR-SALE-OTTAWA – KANATA-HOMES-KANATA-OTTAWA HOMES FOR SALE – OTTAWA HOME PRICES FEBRUARY 2022- OTTAWA CONDOS FOR SALE FEBRUARY 2022 – LATEST OTTAWA REAL ESTATE NEWS.
JOIN MY NEWSLETTER

WHAT WE DO FOR OUR CLIENTS – 13 OFFERS – SOLD IN 7 DAYS
HOW MUST IS MY HOME WORTH?

HOMES-FOR-SALE-OTTAWA – KANATA-HOMES-KANATA-OTTAWA HOMES FOR SALE – OTTAWA HOME PRICES FEBRUARY 2022- OTTAWA CONDOS FOR SALE FEBRUARY 2022 – LATEST OTTAWA REAL ESTATE NEWS.
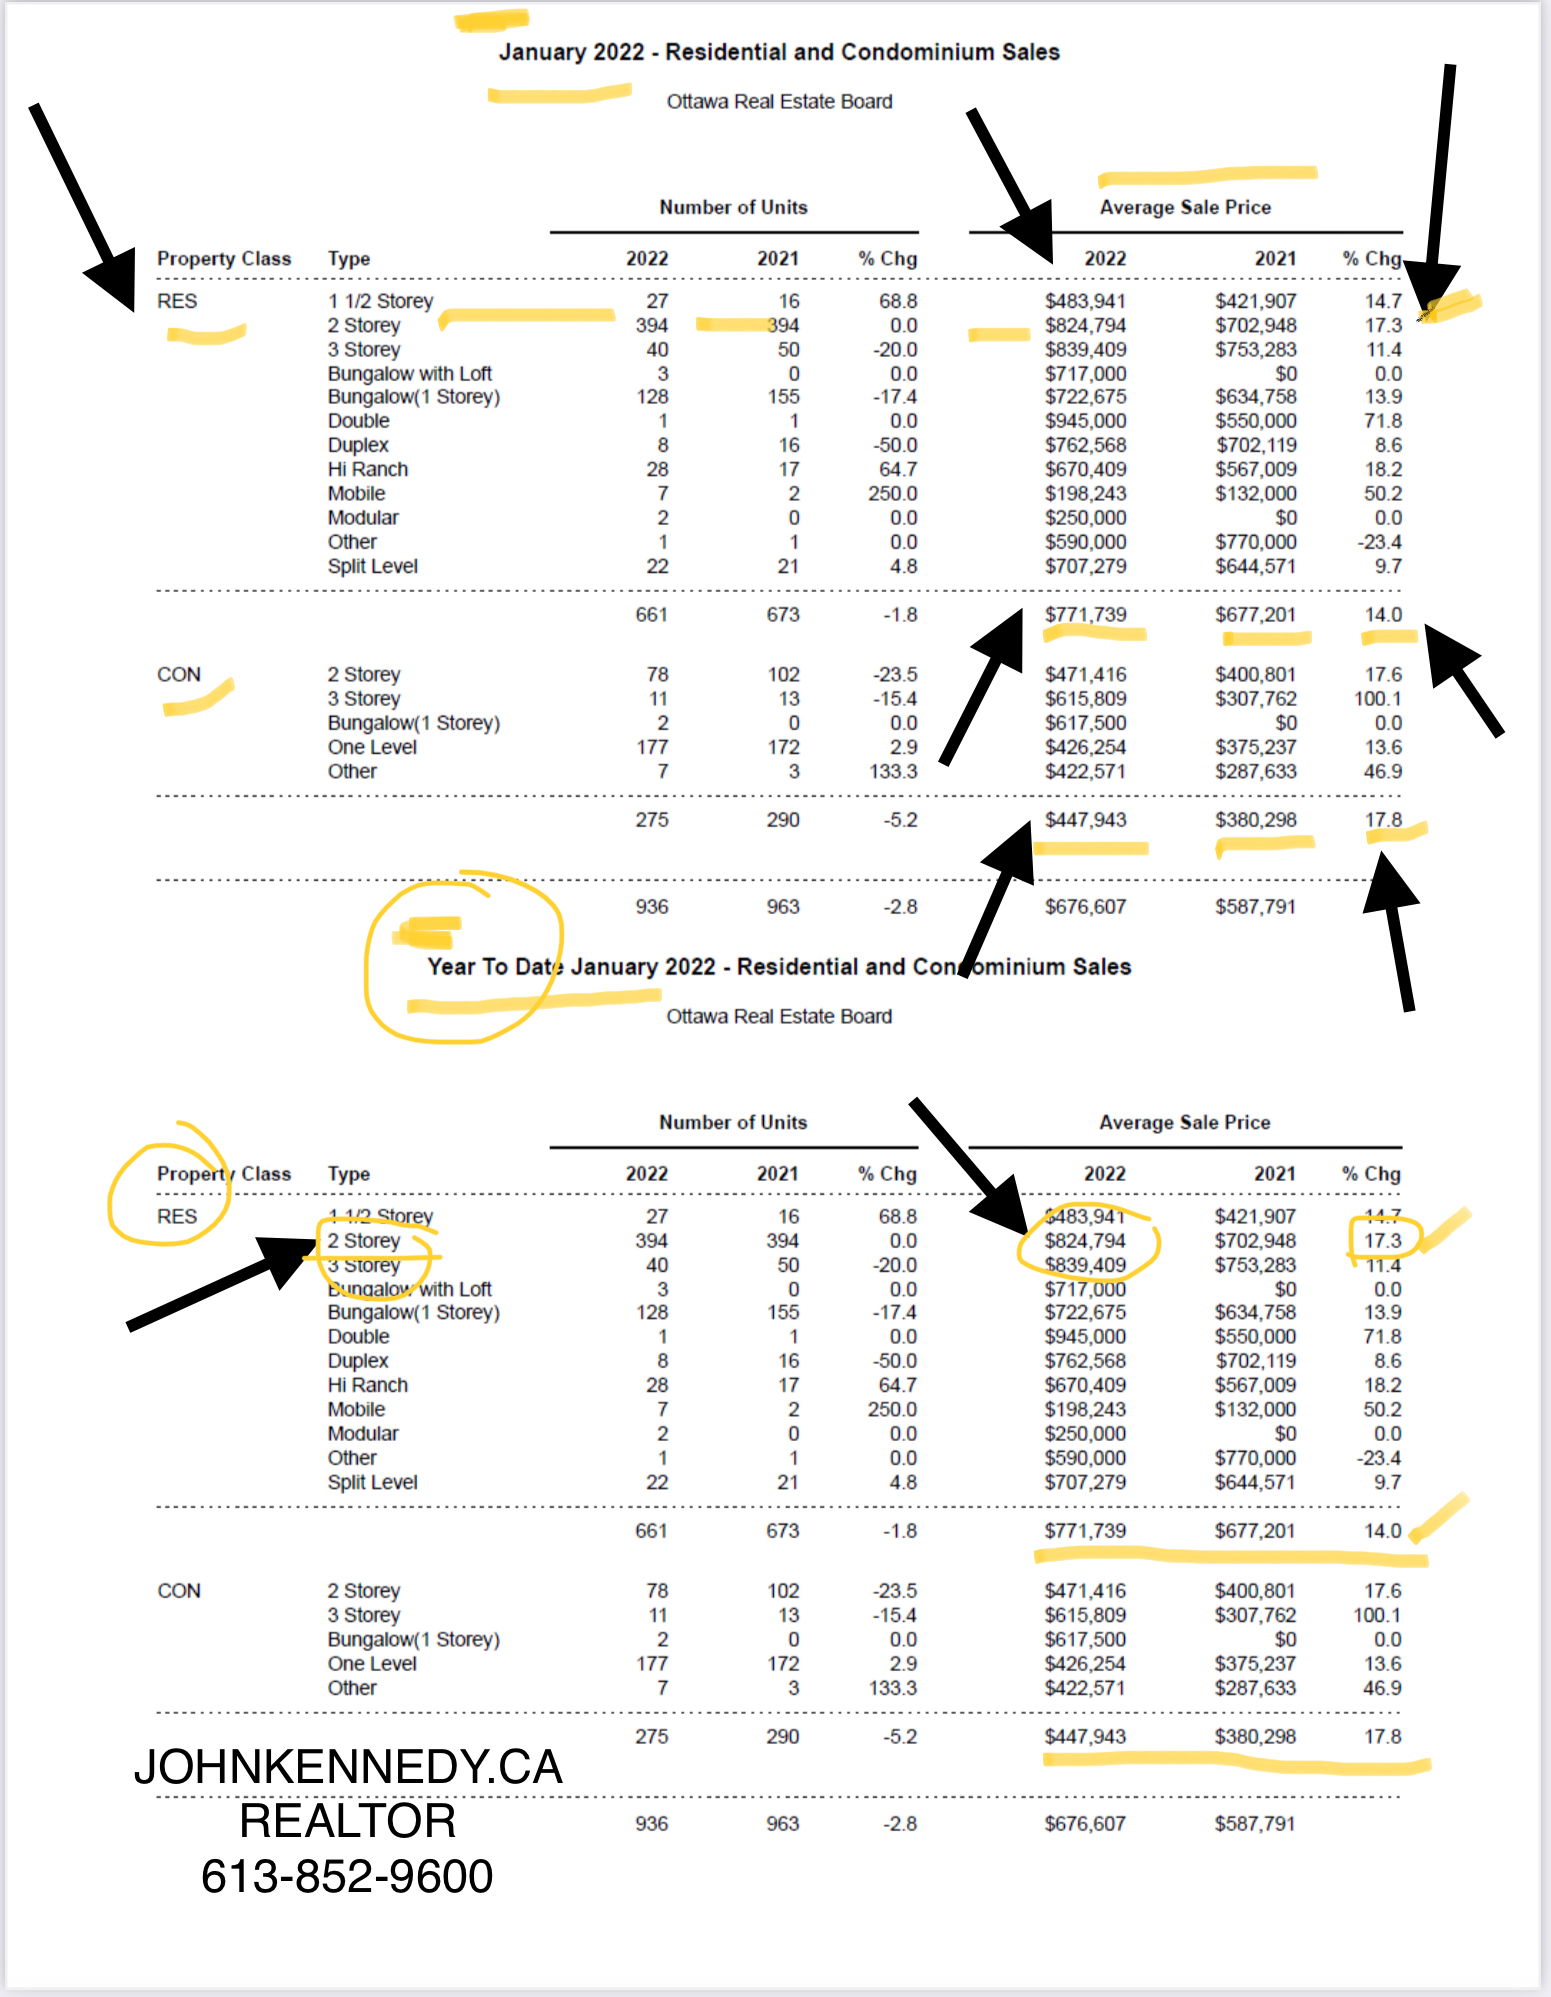
February 2022 – OTTAWA REAL ESTATE PRICES UP +17.8%
The Members of the Ottawa Real Estate Board sold 936 residential properties in January through the Board’s Multiple Listing Service® System, compared with 963 in January 2021, a decrease of 3 per cent. January’s sales included 661 in the residential-property class, down 2 per cent from a year ago, and 275 in the condominium-property category, a decrease of 5 per cent from January 2021. The five-year average for total unit sales in January is 840.
“January’s sales, almost identical to 2021’s, were very strong for a traditionally slower month, especially given the frigid temperatures and increased government Covid-19 restrictions we experienced,” states Ottawa Real Estate Board President Penny Torontow. “This increased activity compared to previous years is not solely a pandemic phenomenon. Yes, the pandemic has accelerated market activity in some ways, but pent-up Buyer demand due to the housing supply shortage has been an ongoing fundamental issue for the Ottawa resale market for well over 5 years now – and the price increases will continue to reflect that until the housing stock grows.”
The average sale price for a condominium-class property in January was $447,943, an increase of 18 per cent from 2021, while the average sale price for a residential-class property was $771,739, increasing 14 per cent from a year ago.*
“Average prices continue to rise steadily with the lack of inventory pushing prices to levels previously unseen. We only need to observe the number of homes now selling over $1M for a clear demonstration. In 2020, they represented 3% of residential sales, in 2021, they held 9% of the market’s resales, and now in 2022, that number reflects close to 14% of detached home sales.”
“Meanwhile, the residential-class properties selling within the $650-$900K range represent 47% of all of January’s residential unit sales. In 2021, it was 33%. But we must keep in mind, average prices statistics amalgamate data from the entire city, so while in some areas the increases would be less, other pockets of Ottawa may see more,” advises Torontow.
“The condo market is also flourishing both in number of sales and prices. Possibly due to the fact that residential units may be out of reach for some Buyers, they are finding themselves more open to this option and are actually able to find a condominium-class property within their budget.”
“Bad weather, pandemic lockdowns, it doesn’t matter – Ottawa remains a fast-moving, active, and robust market. So, if you are thinking of selling your property, there has never been a better time. Contact a REALTOR® who can explain the various factors that will help you get the best price for your home today.” In addition to residential sales, OREB Members assisted clients with renting 410 properties in January 2022 compared to 333 in 2021.
* OREB cautions that the average sale price can be useful in establishing trends over time but should not be used as an indicator that specific properties have increased or decreased in value. The calculation of the average sale price is based on the total dollar volume of all properties sold. Price will vary from neighbourhood to neighbourhood.
source OREB.
HOMES-FOR-SALE-OTTAWA – KANATA-HOMES-KANATA-OTTAWA HOMES FOR SALE – OTTAWA HOME PRICES FEBRUARY 2022- OTTAWA CONDOS FOR SALE 2022 – LATEST OTTAWA REAL ESTATE NEWS.
JUST SOLD
AVERAGE MOVING PRICE FEB 2022
JUST SOLD
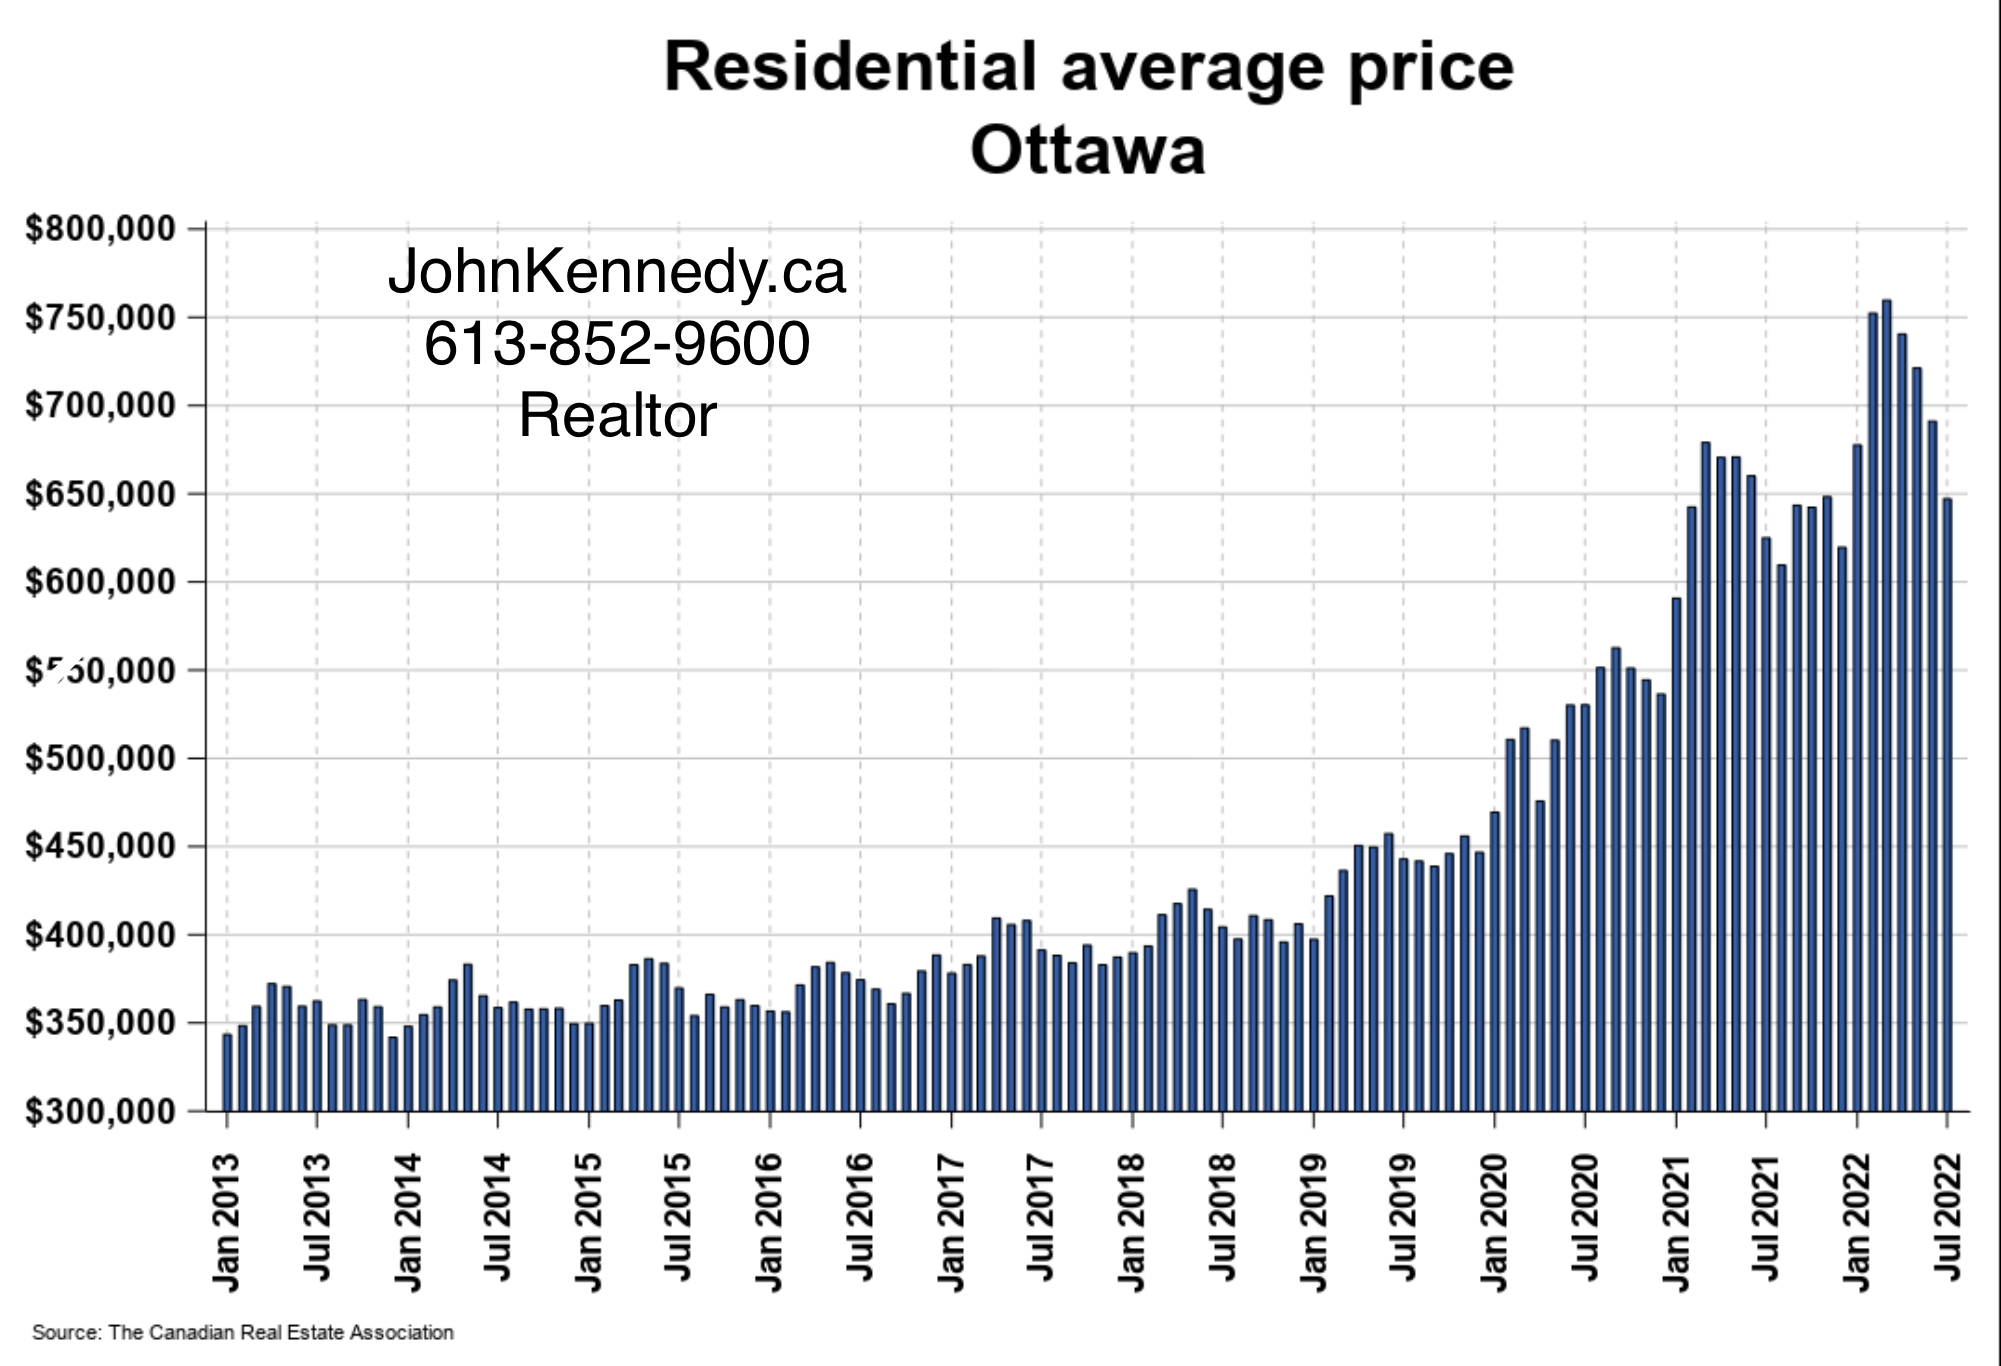
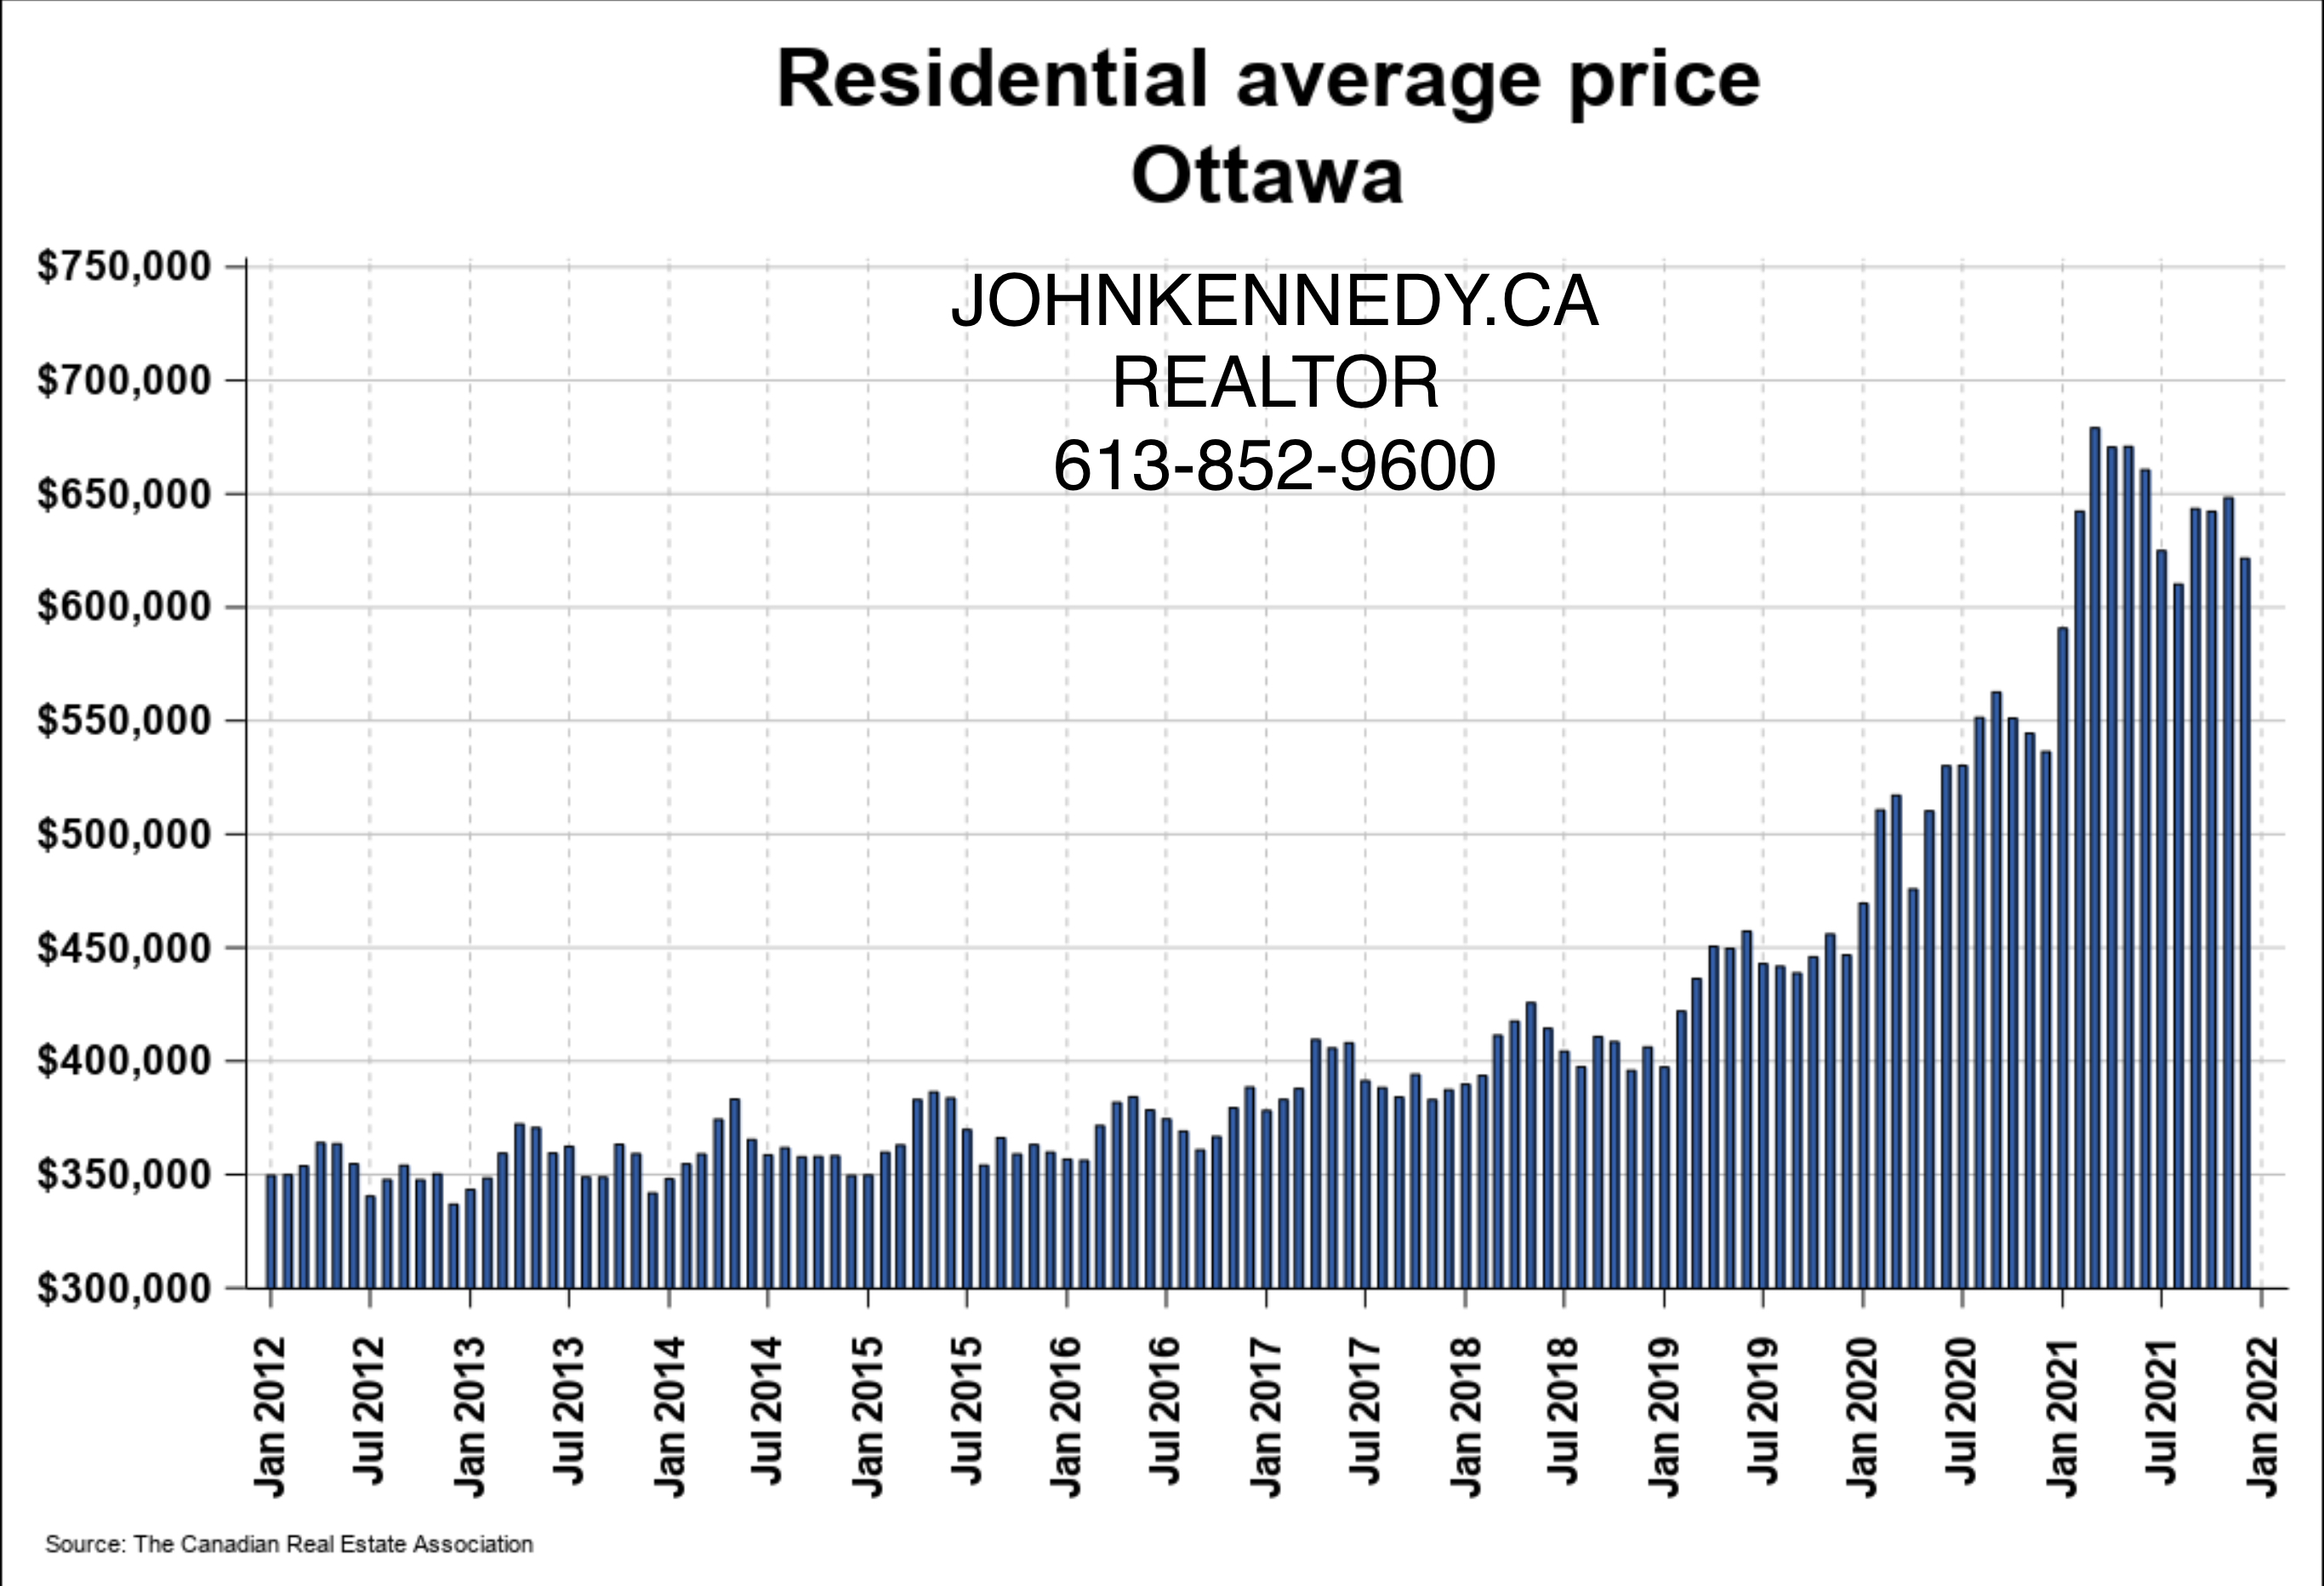
OTTAWA AVERAGE PRICES FROM JAN 2012 TO FEB 2022
RECEIVE FREE PROFESSIONAL ADVICE BEFORE YOU BUY OR SELL.
AVERAGE PRICE CHANGES BY MONTH
HOMES-FOR-SALE-OTTAWA – KANATA-HOMES-KANATA-OTTAWA HOMES FOR SALE – OTTAWA HOME PRICES FEBRUARY 2022- OTTAWA CONDOS FOR SALE FEBRUARY 2022 – LATEST OTTAWA REAL ESTATE NEWS.
JOIN MY NEWSLETTER
WHAT WE DO FOR OUR CLIENTS – 13 OFFERS – SOLD IN 7 DAYS

Kanata Homes for Sale – March 13, 2021
-
The Question this week in Kanata real estate – Ottawa real estate.
-
How can I make a lot of money in real estate?
I received this question just the other day, and really got taken by it. Yes I had the answer, but never really put it into these words. My simple answer to this young man was “ Start buying real estate early” you need to get into the market and stay in it. That way you learn and earn as you go.
-
The money trick to Real Estate “ How can I make a lot of money in real estate.. Answer is simple : (Time = value in Real Estate.) Kanata Real Estate and Ottawa Real Estate are now seeing +31% yearly since Feb 2021. I don’t think anyone can save such funds with a job, savings in a bank vs as in a property.
-
So if you are looking at buying a home, or a condo, or thinking of starting to invest in rental properties, in KANATA or OTTAWA real estate market. You should sit with me, so we can go over your options available.
-
My free 30 minutes advise session will give you the answers and will included a Free pdf booklet:
-
Step by step “Buying your first home” in Kanata or Ottawa.
-
10 steps you should follow when investing in Real Estate and plan to retire at 55.
-
Step by step real estate investment guide.
-
Real estate getting started “ leveraging” and why this works.
-
No fees for buyers !
-
Have more questions in Kanata Real Estate or Ottawa Real Estate shoot me an email.
-
Your local Kanata and Ottawa homes for sale expert.
-
As Always: here to help, always talking Real estate, always loving real estate.
HOMES WITH 4 BEDROOMS SOLD PRICES IN KANATA TODAY
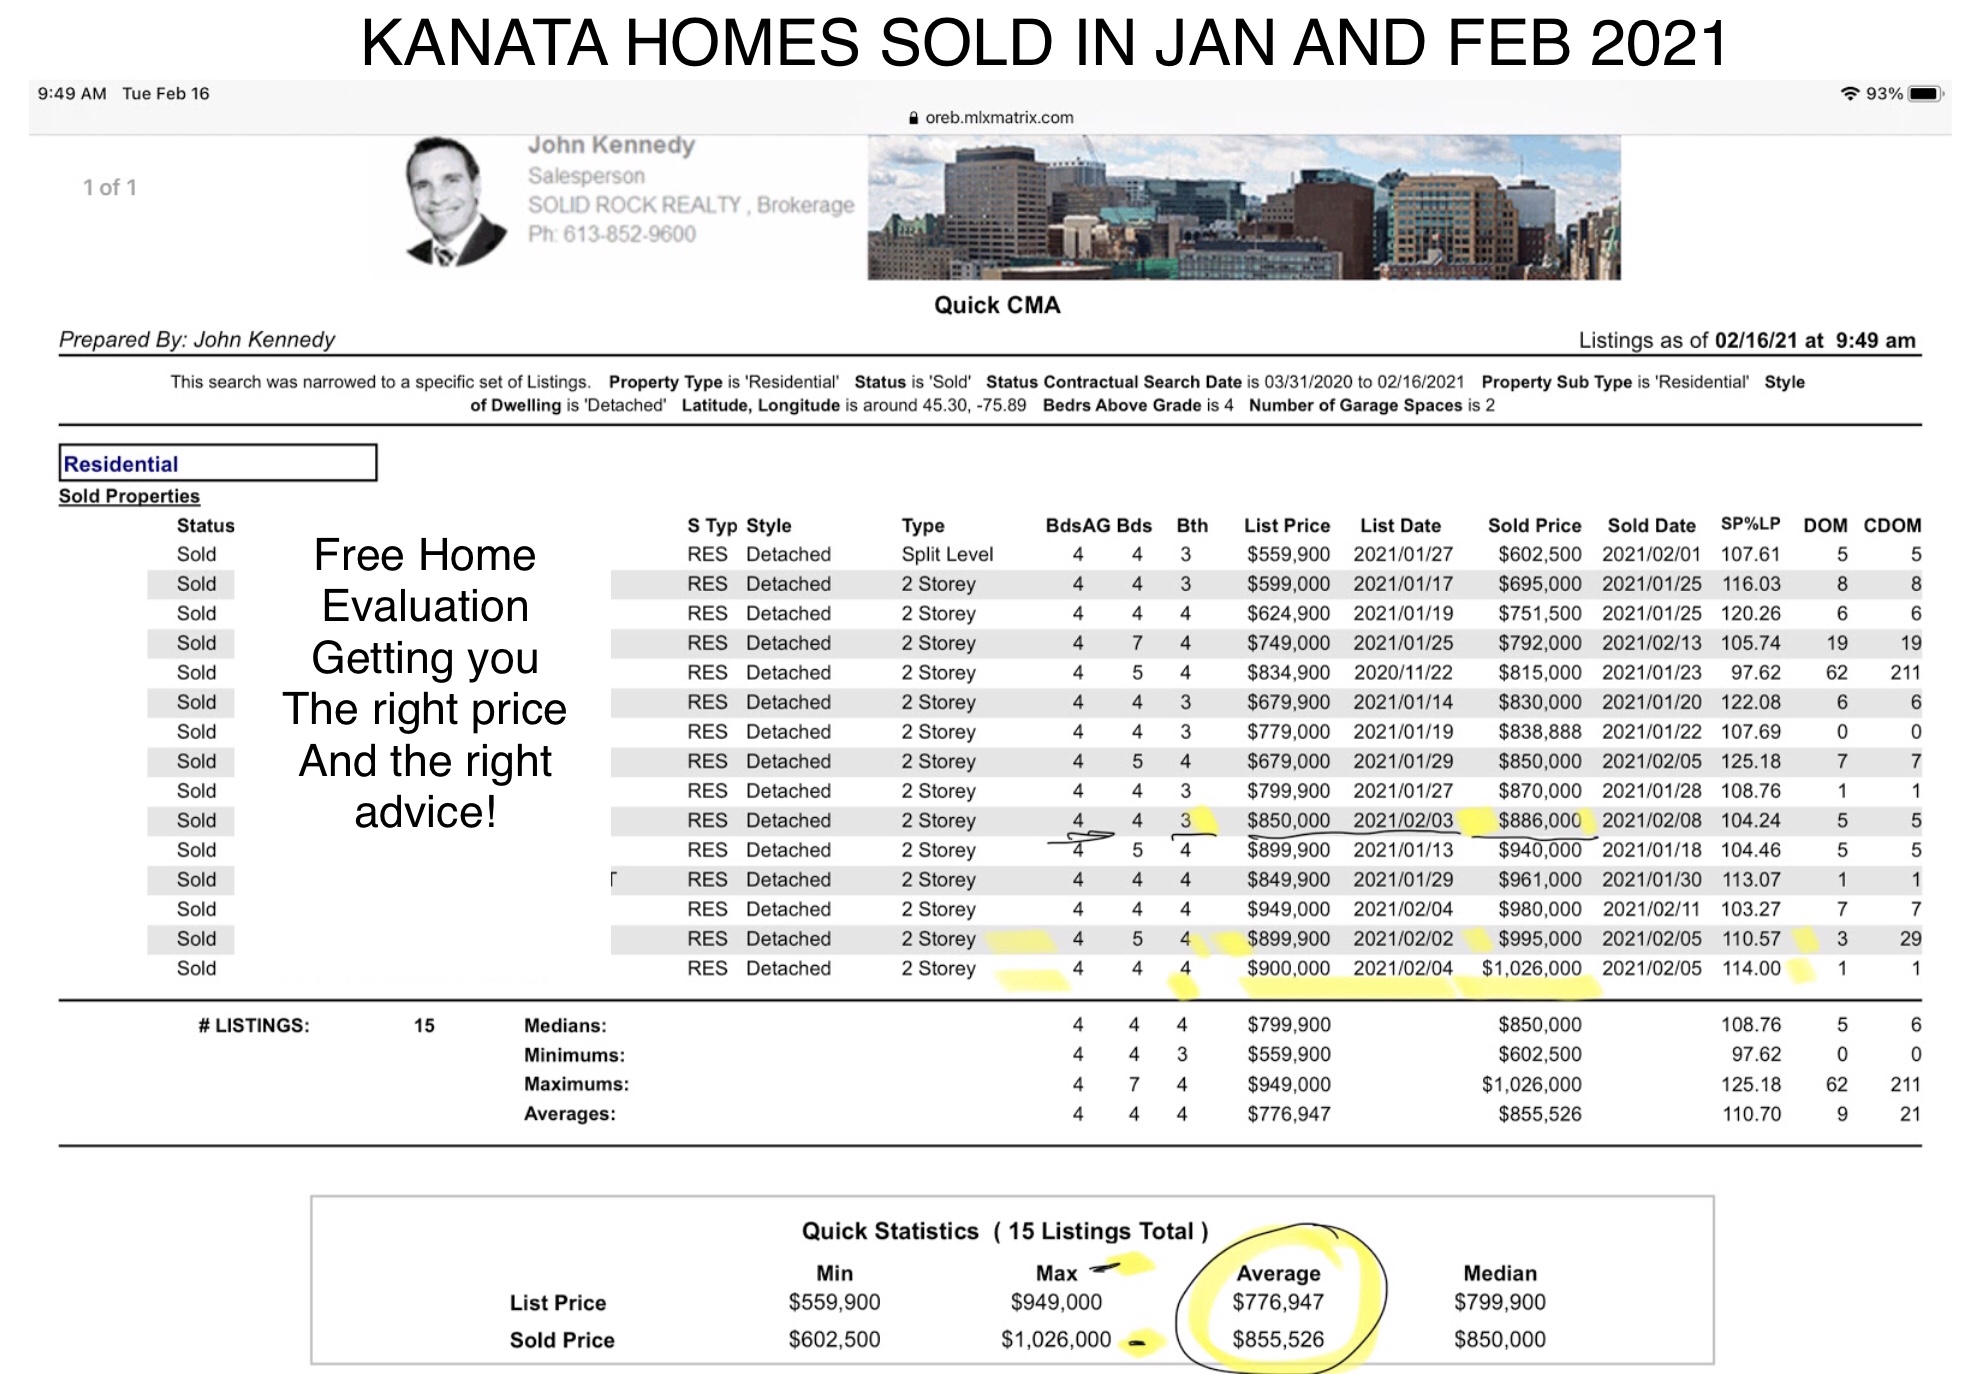
Source OREB
Kanata Homes for Sale
REQUEST A FREE HOME EVALUATION

HOMES WITH 4 BEDROOMS SOLD PRICES IN KANATA TODAY
Source OREB
Kanata Homes for Sale
REQUEST A FREE HOME EVALUATION

HOMES WITH 4 BEDROOMS SOLD PRICES IN KANATA TODAY
Source OREB
REQUEST A FREE HOME EVALUATION
About John – Realtor

SELLER’S GUIDE

FREE HOME EVALUATIONS

BUYER’S GUIDE

GOVERNMENT PROGRAMS

New Listings Alert Daily

NEWSLETTER – MARKET INFO

FACEBOOK PAGE

HOMES
HOMES AND CONDOS FOR SALE OTTAWA-KANATA-BARRHAVEN


OTTAWA REAL ESTATE