No Comments

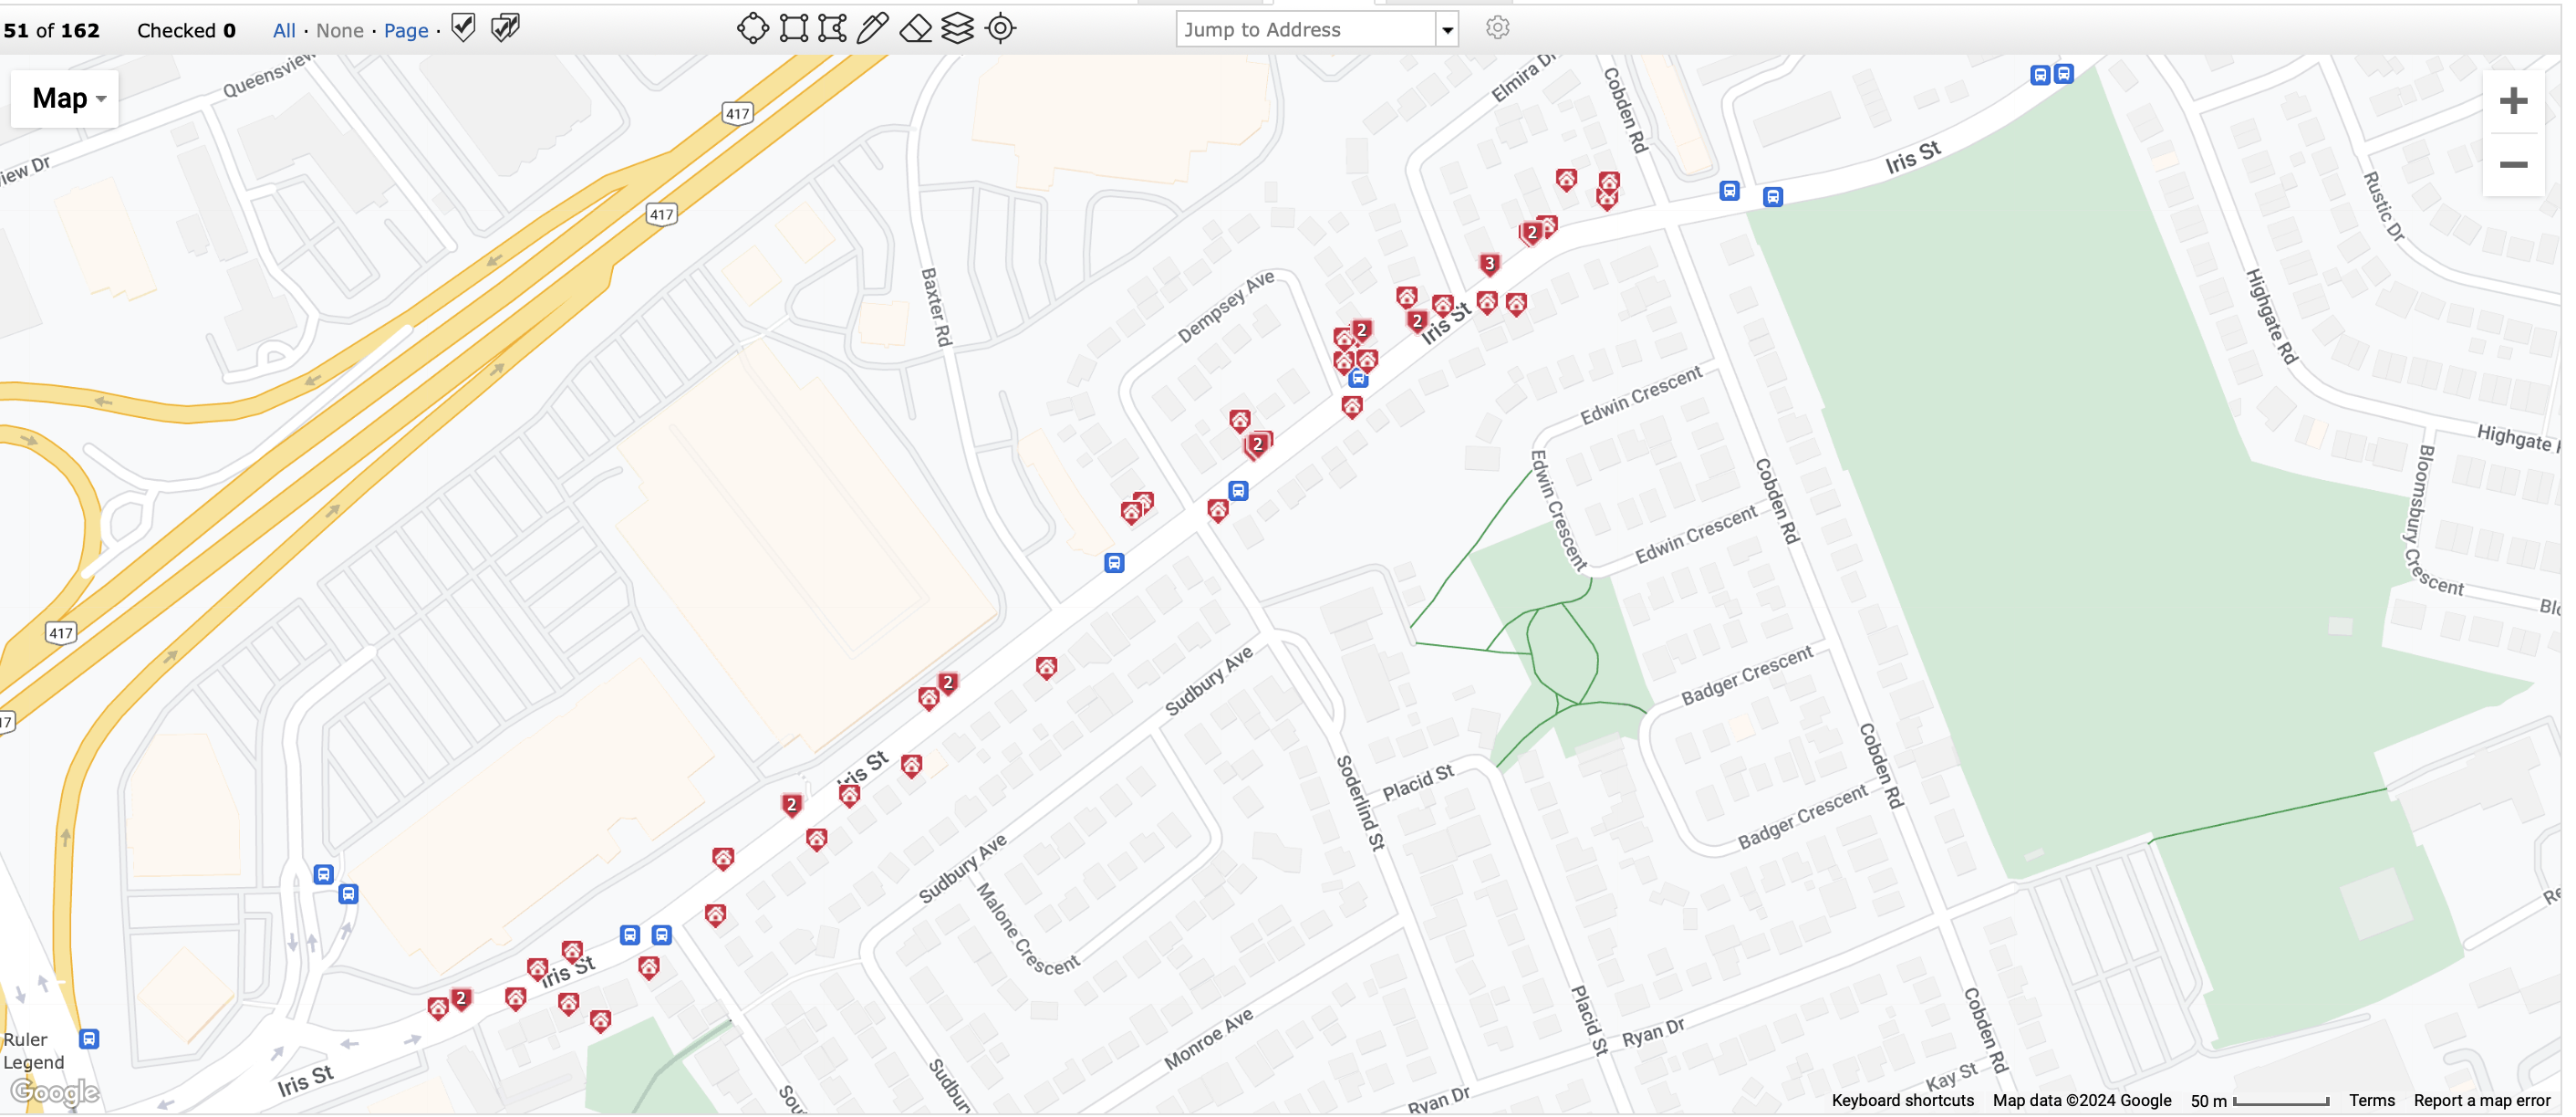
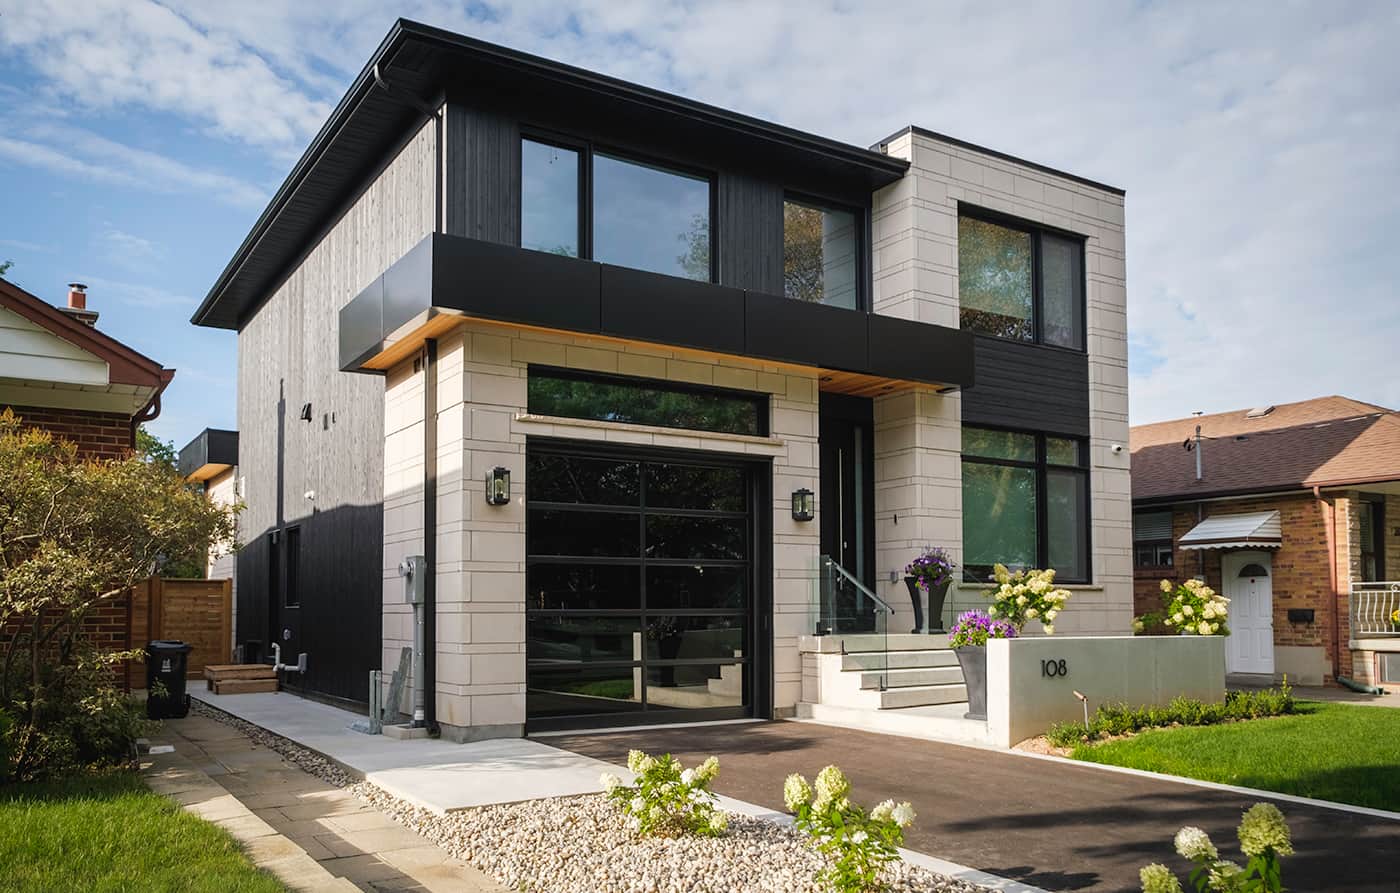
JUST SOLD – 2380 IRIS ST., OTTAWA, ONTARIO, K2C-1C6 – CURRENT PRICES FOR HOMES AROUND IRIS ST OTTAWA

OMES FOR SALE ON IRIS ST OTTAWA - OTTAWA HOMES FOR SALE - OTTAWA HOME PRICES -

LET ME SHOW YOU A “FREE HOME EVALUATION” SIMILAR TO THIS – ESTIMATING THE PROPER VALUE OF A PROPERTY ON IRIS ST. OTTAWA

Example only:

IRIS ST OTTAWA HOME PRICES

HOME PRICES ON IRIS ST. OTTAWA

Address Sold Price Sold Date Style Type BdsAG Bds Bths #Gar
2403 IRIS ST $557,500 2024-05-29 SEMIDET BUNGLOW 3 3 2 0
2380 IRIS ST $540,000 2024-05-15 SEMIDET BUNGLOW 3 3 2 0
2419 IRIS ST $619,000 2023-06-16 SEMIDET BUNGLOW 3 5 2 1
2394 IRIS ST $562,500 2023-04-06 SEMIDET BUNGLOW 3 3 2 0
2399 IRIS ST $577,000 2022-09-29 SEMIDET BUNGLOW 3 3 2 0
2411 IRIS ST $635,000 2022-08-24 SEMIDET BUNGLOW 3 4 2 0
2418 IRIS ST $690,000 2022-06-09 SEMIDET BUNGLOW 3 6 2 0
2357 IRIS ST $651,000 2022-03-10 SEMIDET BUNGLOW 3 3 1 0
2434 IRIS ST $656,100 2022-02-02 SEMIDET 2STOREY 3 3 2 0
2239 IRIS ST $575,000 2021-10-31 SEMIDET 2STOREY 3 3 2 1
2361 IRIS ST $575,000 2021-08-11 SEMIDET BUNGLOW 3 3 2 0
2240 IRIS ST $325,000 2019-08-08 SEMIDET 2STOREY 3 3 1 0
2427 IRIS ST $239,900 2017-10-23 SEMIDET BUNGLOW 3 3 1 0
2416 IRIS ST $325,300 2016-11-22 SEMIDET BUNGLOW 3 3 2 0
2411 IRIS ST $312,000 2016-11-10 SEMIDET BUNGLOW 2 2 2 0
2382 IRIS ST $303,000 2016-01-21 SEMIDET BUNGLOW 3 4 2 1
2422 IRIS ST $302,000 2014-07-20 SEMIDET BUNGLOW 3 3 2 0
2400 IRIS ST $282,500 2011-12-11 SEMIDET BUNGLOW 3 3 2 0
2238 IRIS ST $290,000 2011-10-03 SEMIDET 2STOREY 3 4 2 0
2396 IRIS ST $284,000 2011-09-14 SEMIDET BUNGLOW 3 4 2 0
2247 IRIS ST $320,000 2011-06-10 SEMIDET 2STOREY 3 3 2 1
2412 IRIS ST $272,000 2010-07-26 SEMIDET BUNGLOW 3 4 2 0
2413 IRIS ST $269,000 2009-10-02 SEMIDET BUNGLOW 3 5 2 0
2419 IRIS ST $264,300 2009-06-15 SEMIDET BUNGLOW 3 5 2 1
2397 IRIS ST $190,000 2009-02-18 SEMIDET BUNGLOW 2 2 1 0
2415 IRIS ST $227,500 2008-11-11 SEMIDET BUNGLOW 3 3 1 0
2393 IRIS ST $245,000 2008-06-04 SEMIDET BUNGLOW 3 3 2 0
2421 IRIS ST $213,000 2007-03-21 SEMIDET BUNGLOW 3 3 1 0
2419 IRIS ST $205,000 2006-11-26 SEMIDET BUNGLOW 3 3 2


REQUEST A FREE HOME EVALUATION OF IRIS ST. OTTAWA

HOMES FOR SALE ON IRIST ST. OTTAWA –

2380 IRIS ST, OTTAWA, ONTARIO, K2C-1C6

IRIS ST, OTTAWA, ONTARIO, K2C-1C6

IRIS ST, OTTAWA, HOMES FOR SALE

K2C HOMES FOR SALE

OTTAWA HOME GUIDES

THINKING OF BUYING A HOME ON IRIS ST. OTTAWA?


No Comments

Buying a Brand new home in Ottawa – Questions you should ask: Sept 2023

Buying a Brand new home Q and A.

Questions you should ask before Buying a Brand new home in Ottawa: Sept 2023


Builder Agreements should include details such as:

PDI – Date

Assignment clause: a must

Evaluation of home value (Appraisal – you should pay for one)

Deposit Structure: Can you get a better deposit structure

Mortgage approval – a must

Pre-approval – a must

Insurance clause – a must


Location:

Flooding topography

Hwy access

Hydro box green

Road T

SITE PLAN disclosure – commercial or other future development, check with the city

Backing on to graveyards or other

WHAT FUTURE DEVELOPMENT WILL HAPPEN AROUND THE HOME is very import to value

Shopping close

Schools

Bus stops


Structure:

Model

Sqft cost

List of actual finishes

Design

Floor plan

How long is your Tarion Warranty, and what is under warranty and for how long?

Upgrades list and value $

Builder Insurance coverage


(* for information only  – buyers need legal advice or to work with an agent)


Ottawa homes for sale

Kanata Homes for sale

Orleans homes for sale

Barrhaven homes for sale


No Comments

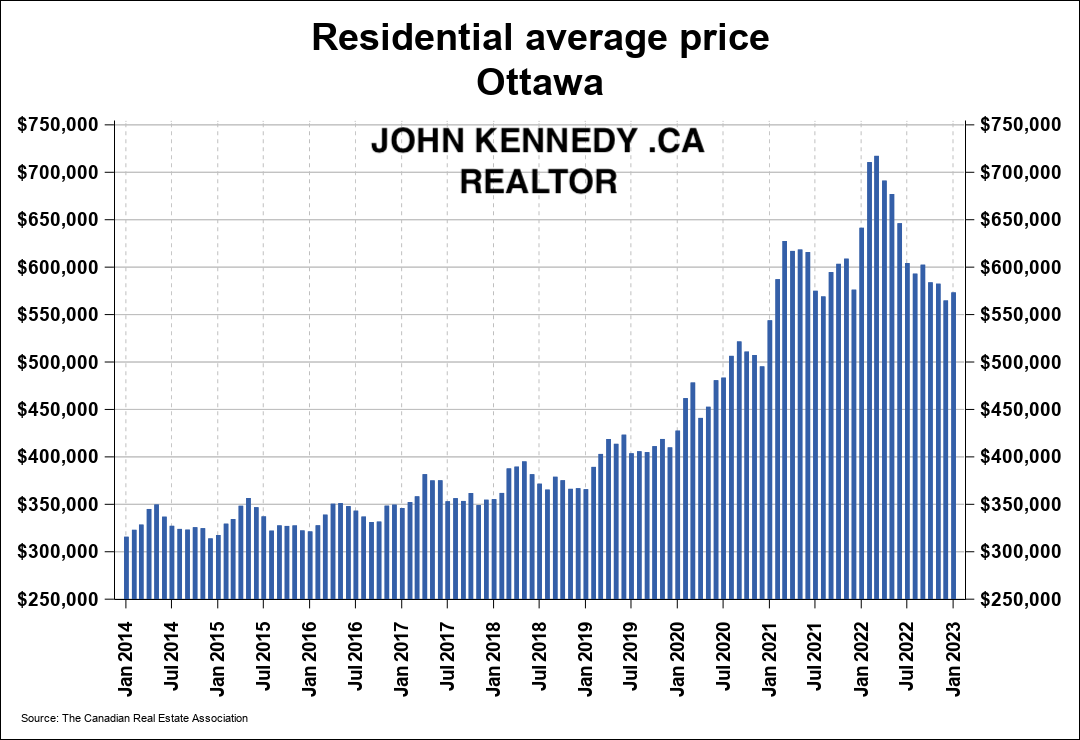
Residential in Ottawa Real Estate shows -15% Down from last year Average price – Ottawa Homes for Sale – Kanata homes for sale – Barrhaven homes for sale

Residential in Ottawa Real Estate shows -15% Down from last year Average price – However, it marks a 5% increase over January 2023.

Resale Market Stabilizes in February with a Glimmer of Hope for Buyers and Sellers Alike!

OREB NEWS

March 3, 2023

Members of the Ottawa Real Estate Board (OREB) sold 855 residential properties in February through the Board’s Multiple Listing Service® (MLS®) System, compared with 1,411 in February 2022, a decrease of 39%. February’s sales included 633 in the freehold-property class, down 42% from a year ago, and 222 in the condominium-property category, a decrease of 31% from February 2022. The five-year average for total unit sales in February is 1,157.

“We’re going to see declines in transactions and prices when we compare current figures to last February — the height of the pandemic resale market activity,” says Ottawa Real Estate Board’s President Ken Dekker. “On the other hand, with the Bank of Canada holding interest rates steady, prospective buyers have more budget certainty to work with as we head into the spring market.”

By the Numbers – Average Prices*:

  • The average sale price for a freehold-class property in February was $708,968, a decrease of 15% from 2022. However, it marks a 5% increase over January 2023.
  • The average sale price for a condominium-class property was $410,927, decreasing 12% from a year ago.
  • With year-to-date average sale prices at $695,086 for freeholds and $411,449 for condos, these values represent a 14% decrease over 2022 for freehold-class properties and a 10% decrease for condominium-class properties.

“The average price increase for freeholds over January could be an indicator that buyers have normalized to the current interest rates. And perhaps, it’s a glimmer of more activity to come in the months ahead.”

By the Numbers – Inventory & New Listings:

  • Months of Inventory for the freehold-class properties has increased to 2.8 months from 0.7 months in February 2022.
  • Months of Inventory for condominium-class properties has increased to 2.5 months from 0.7 months in February 2022.
  • February’s new listings (1,366) were 22% lower than February 2022 (1,762) and up 3% from January 2023 (1,323). The 5-year average for new listings in February is 1,632.
  • Days on market (DOM) for freeholds decreased from 43 to 37 days and 47 to 43 days for condos compared to last month.

“A decrease in the days on market, paired with fewer new listings entering the market, is good news for sellers,” says Dekker. “However, if that trend continues to impact our supply stock and we don’t get more inventory, our otherwise balanced market could swing back into seller’s territory — but it’s too early to predict.”

“The best advice for sellers and buyers in today’s market is to pay close attention to the comparison and competition insights only a REALTOR® can offer. Ottawa is made up of many micro-markets, and neighbourhood-level data is vital to standing out and closing deals.”

REALTORS® also help with finding rentals and vetting potential tenants. Since the beginning of the year, OREB Members have assisted clients with renting 995 properties compared to 800 last year at this time, an increase of 24%.


Details:

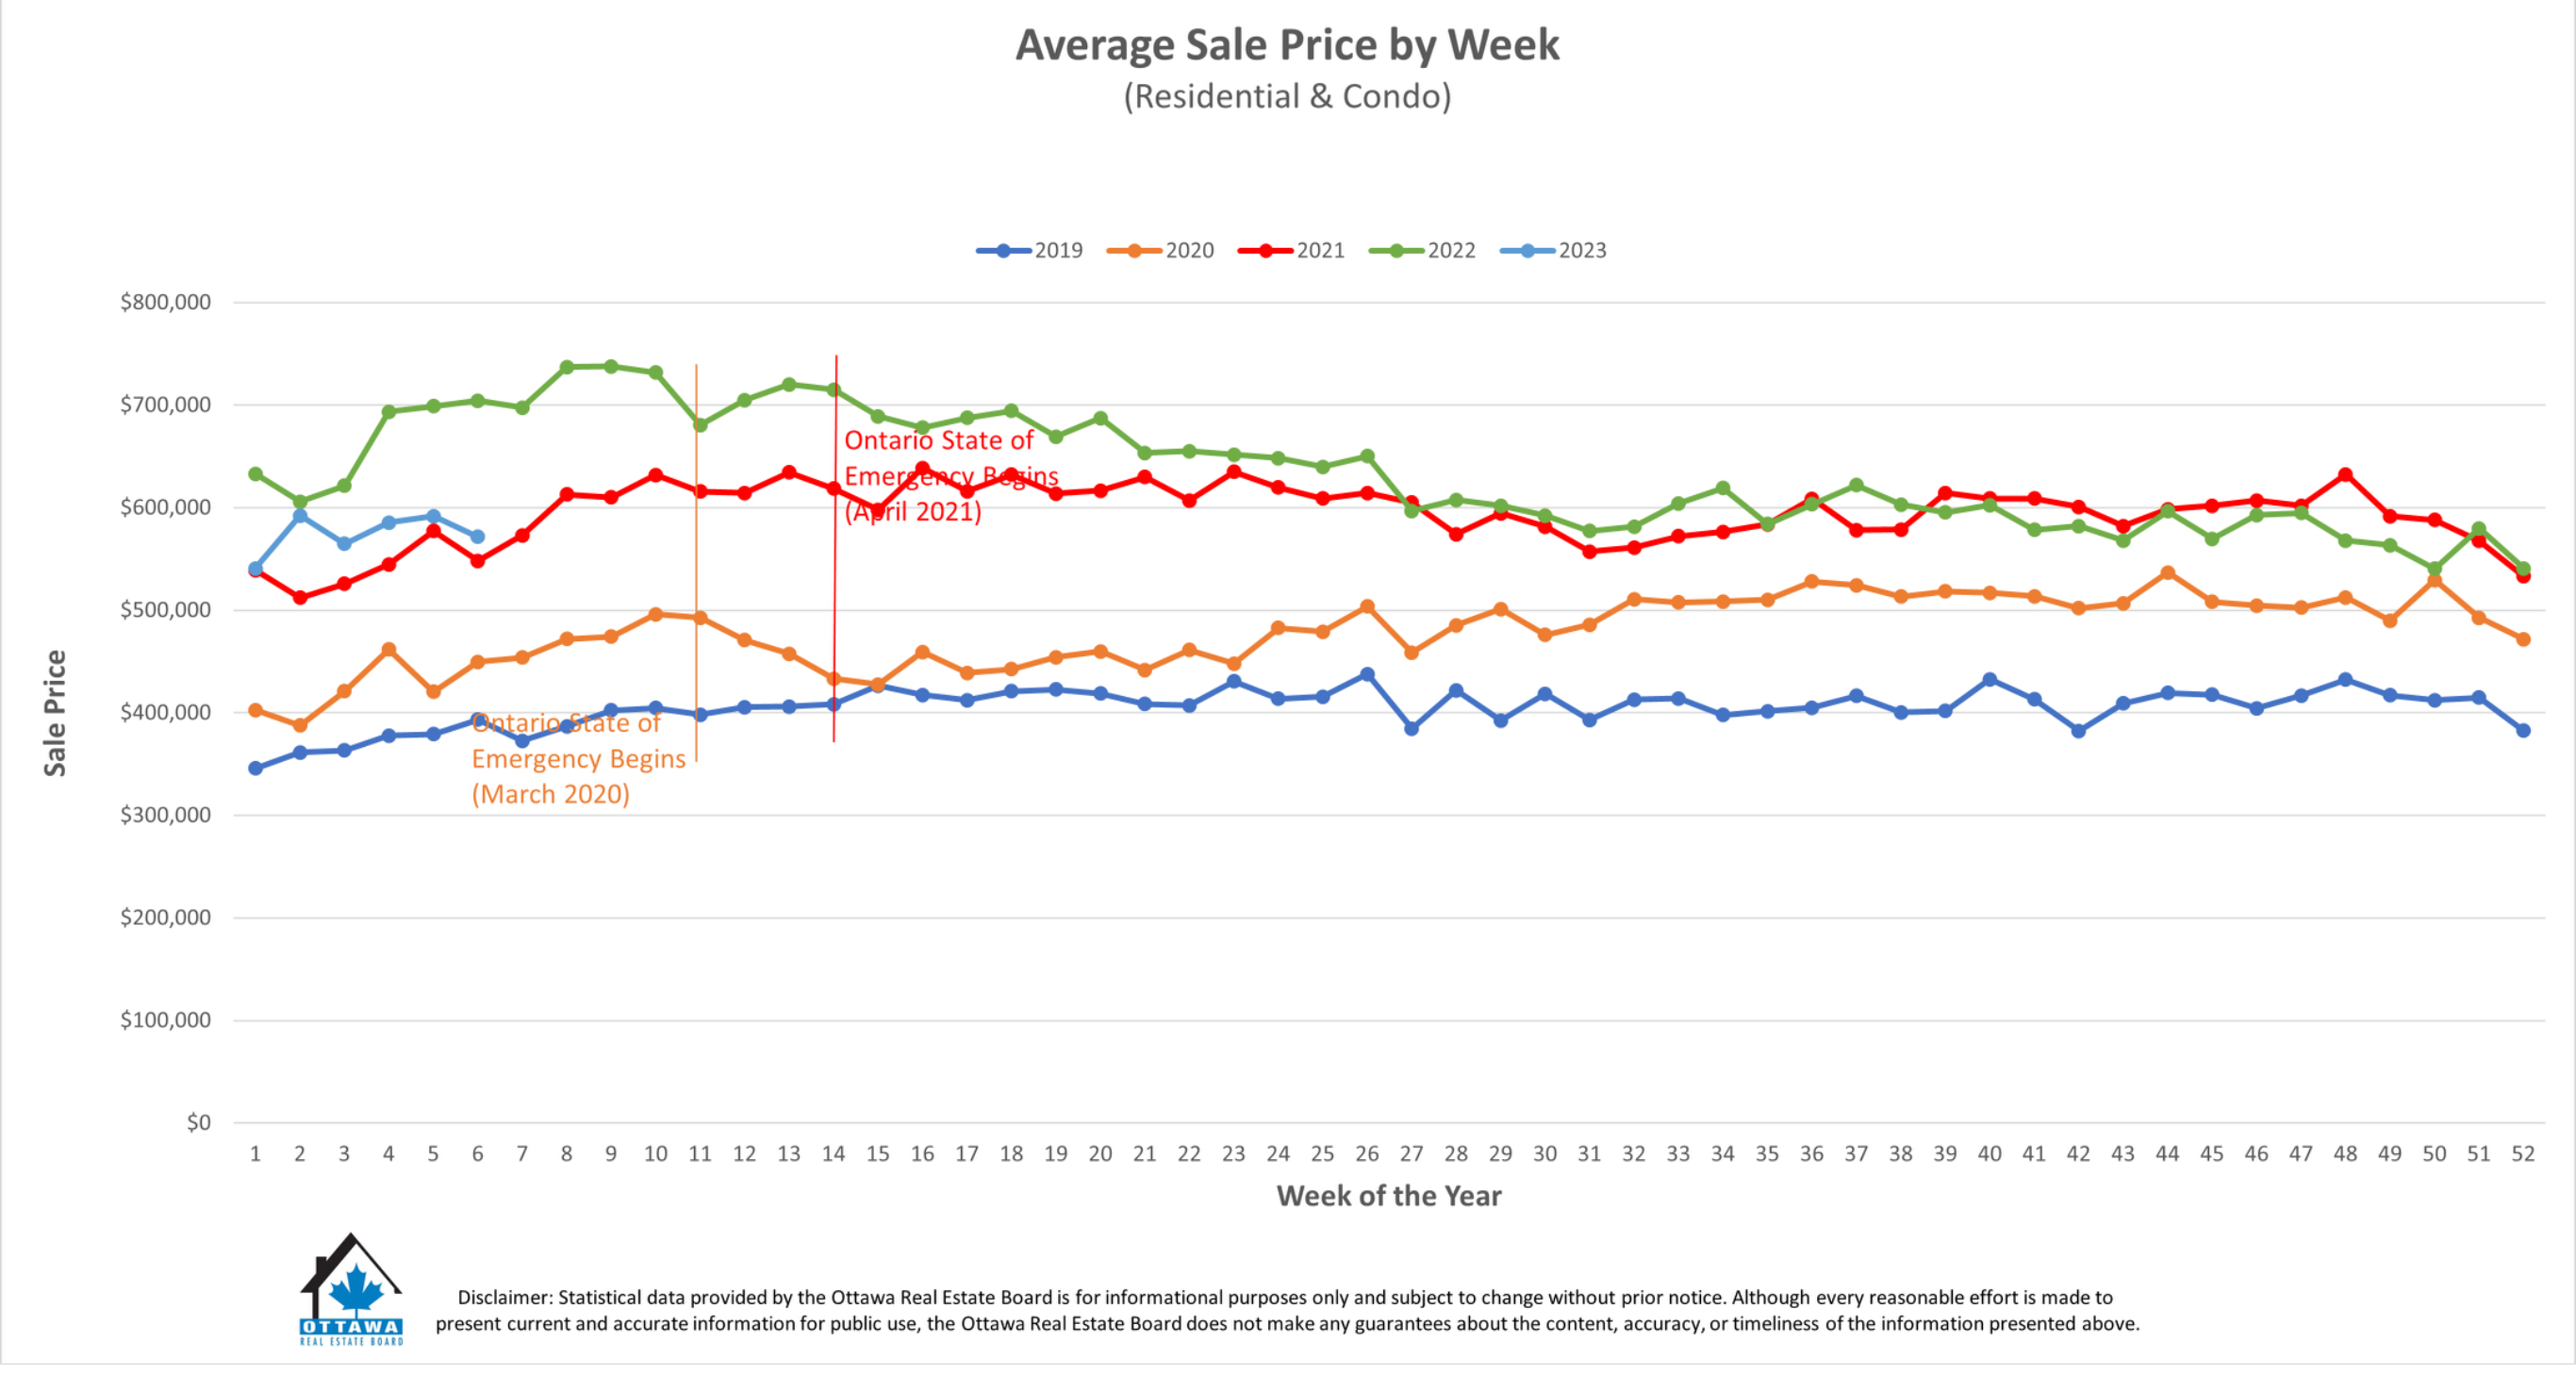
Average Sale Price February 2023= from $708,172 down to $620,088 (-12.4% down)

Quantity of sales: 2471 down to 1513 in Feb 2023 (-38% down)

CDOM= Re-listed : Days on Market from 27 to 69 days ( more days on market:  +42 days)

DOM= Days on Market – from 19 days TO 44 days longer in 2023 ( more days on market:  +25 days)


No Comments

Ottawa Real Estate Market news Feb 2023 – Kanata Real Estate Market news Feb 2023 – Join our newsletter

February 2023 – Resale Market Starts Slow as Buyers Remain Cautious

February 2, 2023

Members of the Ottawa Real Estate Board (OREB) sold 606 residential properties in January through the Board’s Multiple Listing Service® (MLS®) System, compared with 933 in January 2022, a decrease of 35%. January’s sales included 460 in the freehold-property class, down 30% from a year ago, and 146 in the condominium-property category, a decrease of 47% from January 2022. The five-year average for total unit sales in January is 819.

“January’s marked slow down in unit sales over 2022 indicates potential home buyers are taking their time,” says OREB President Ken Dekker. “While last month saw the culmination of the succession of interest rate hikes announced by the Bank of Canada, affordability remains a factor. They may be waiting for a shift in listing prices. They’re being cautious in uncertain conditions.”

By the Numbers – Average Prices*:

  • The average sale price for a condominium-class property in January was $412,244, a decrease of 8% from 2022.
  • The average sale price for a freehold-class property was $676,272, decreasing 12% from a year ago.

“Despite the decrease in average prices, the market should not be considered on a downward slide,” says Dekker. “A hyper COVID-19 seller’s market is now leveling out to our current balanced market state.”

“On a positive note, in comparison to December’s figures, January’s average price of freehold properties increased by 3%. The average price of condos did fall by 5% compared to December but condo pricing tends to fluctuate more due to the small data set.”

By the Numbers – Inventory & New Listings:

  • Months of Inventory for the freehold-class properties has increased to 3.8 months from 0.9 months in January 2022.
  • Months of Inventory for condominium-class properties has increased to 3.8 months from 0.8 months in January 2022.
  • January’s new listings (1,324) were 16% higher than 2022 (1,142) and up 89% from December 2022 (699). The 5-year average for new listings in January is 1,233.

“Ottawa’s inventory and days on market figures are typical for a balanced market and another sign that buyers are no longer racing to put in an offer,” says Dekker. “The increase in new listings and supply is a boon for home buyers, who now have more selection and the ability to put in conditions at a less frantic pace. REALTORS® are an essential resource in finding the right property for the right buyer. On the other side of the transaction, REALTORS® can help sellers with hyper-local insights about how to sell in their neighbourhood at a time when pricing is key.”

More people are turning to REALTORS® for help renting properties — 509 this month compared to 410 in January 2022, an increase of 24%. “Even with the increase in housing stock, the tighter rental market is another indication that affordability is keeping some potential buyers on the sidelines.”

* OREB cautions that the average sale price can be useful in establishing trends over time but should not be used as an indicator that specific properties have increased or decreased in value. The calculation of the average sale price is based on the total dollar volume of all properties sold. Price will vary from neighbourhood to neighbourhood.


Market Prices Sold and Changes

2022 AWARD WINNER FOR SALES AND CUSTOMER SATISFACTION

Thank you for your trust and referrals!


No Comments

The Question this week in Ottawa – Kanata real estate – Ottawa Real Estate News – March 13 2021 – Ottawa homes for Sale – Latest News in Ottawa Real Estate

OTTAWA Homes for Sale – March 13, 2021

  • The Question this week in Kanata real estate – Ottawa real estate.

  • How can I make a lot of money in real estate?

    I received this question just the other day, and really  got taken by it. Yes I had the answer, but never really put it into these words. My simple answer to this young man was “ Start buying real estate early” you need to get into the market and stay in it. That way you learn and earn as you go.

  • The money trick to Real Estate “ How can I make a lot of money in real estate.. Answer is simple : (Time = value in Real Estate.) Kanata Real Estate and Ottawa Real Estate are now seeing +31% yearly since Feb 2021. I don’t think anyone can save such funds with a job, savings in a bank vs as in a property.

  • So if you are looking at buying a home, or a condo, or thinking of starting to invest in rental properties, in KANATA or OTTAWA real estate market. You should sit with me, so we can go over your options available.

  • My free 30 minutes advise session will give you the answers and will included a Free pdf booklet:

  • Step by step “Buying your first home” in Kanata or Ottawa.

  • 10 steps you should follow when investing in Real Estate and plan to retire at 55.

  • Step by step real estate investment guide.

  • Real estate getting started “ leveraging” and why this works.

  • No fees for buyers !

  • Have more questions in Kanata Real Estate or Ottawa Real Estate shoot me an email.

  • Your local Kanata and Ottawa homes for sale expert.

  • As Always: here to help, always talking Real estate, always loving real estate.

Read more

No Comments

Ottawa Real Estate News – Feb 16th 2021 – Ottawa homes for Sale – Latest News in Ottawa Real Estate

Ottawa Real Estate News – Feb 16th 2021 – Ottawa homes for Sale – Latest News in Ottawa Real Estate – OTTAWA HOMES FOR SALE

Prices in Residential went up +31.2% from last January 2020 to January 2021…get the answers from me. Guidance Selling and Buying Real Estate.


 Source: Our Ottawa Real Estate board

REPORT:  Feb 16 2021

Average Prices and Changes

All Real Estate types of properties in Kanata -Ottawa-Orleans. See this next chart on what’s happening to Residential vs other types.

Price ranges Sold and yearly changes


We still have low inventory – it’s a great time to sell


My information and research is based on the CREA and OREB stats and charts for this month.


Pent-up Buyer Demand Drives January’s 2021 Resale Market!

OTTAWA, February 3, 2021 – Members of the Ottawa Real Estate Board sold 964 residential properties in January through the Board’s Multiple Listing Service® System, compared with 778 in January 2020, an increase of 24 per cent. January’s sales included 674 in the residential-property class, up 21 per cent from a year ago, and 290 in the condominium-property category, an increase of 31 per cent from January 2020. The five-year average for total unit sales in January is 786.
“Pent-up Buyer demand fueled the exceptional number of sales that took place in January even as the mid-month lockdown further restricted supply. Earlier in the month, listing activity increased, likely driven by those Sellers waiting until after the holiday season to put their properties on the market.

However, once the Stay-at-Home Order was announced, Sellers pulled back (rightfully so) and the number of properties entering the market declined,” states Ottawa Real Estate Board President Debra Wright.
“Even though inventory is up from last month, it is still down substantially from last year at this time with 43% fewer properties on the market. This inventory shortage coupled with strong demand triggered a brisk pace to the market. We would have certainly seen higher sales numbers if there were more properties available because the demand is definitely there.”

January’s average sale price for a condominium-class property was $380,336, an increase of 13 per cent from last year, while the average sale price of a residential-class property was $677,197, an increase of 31 per cent from a year ago. Compared to December, the average price for residential-class properties has increased by 12 per cent, and the average price for condominium-class units is 7 per cent higher.* range, while last year at this time, there were only 16 transactions. Sustained price movements are better reflected during the mid to latter part of the year, where trends begin to emerge, and comparisons can be drawn,” advises Wright. “This leads me into my next point – market activity has curtailed, there is no question about that, with January resale numbers lower than what we saw in December. But the effects of this second lockdown will not be entirely measurable until the coming months, dependent on when the mandated Stay- at-Home Order is retracted. If the lockdown is extended, that could affect the market in the longer term; however, as we saw last year, the market was resilient throughout and is being driven by the needs of Buyers and Sellers,” Wright concludes.

In addition to residential sales, OREB Members assisted clients with renting 333 properties in January 2021 compared with 243 in January 2020.
* The Board cautions that the average sale price can be useful in establishing trends over time but should not be used as an indicator that specific properties have increased or decreased in value. The calculation of the average sale price is based on the total dollar volume of all properties sold. Price and conditions will vary from neighbourhood to neighbourhood. “I would like to caution those looking at the increase in average prices this month and believing that property values are accelerating at an extreme pace. In January, there was considerable movement in the upper end of the market, which caused a bit of an anomalous outcome in average price percentages. For example, there were 63 sales in the $1M+ price


OTTAWA HOMES FOR SALE

EASY TO BOOK A SHOWING AND RECEIVED A FREE PROPERTY EVALUATION.

Verified by MonsterInsights