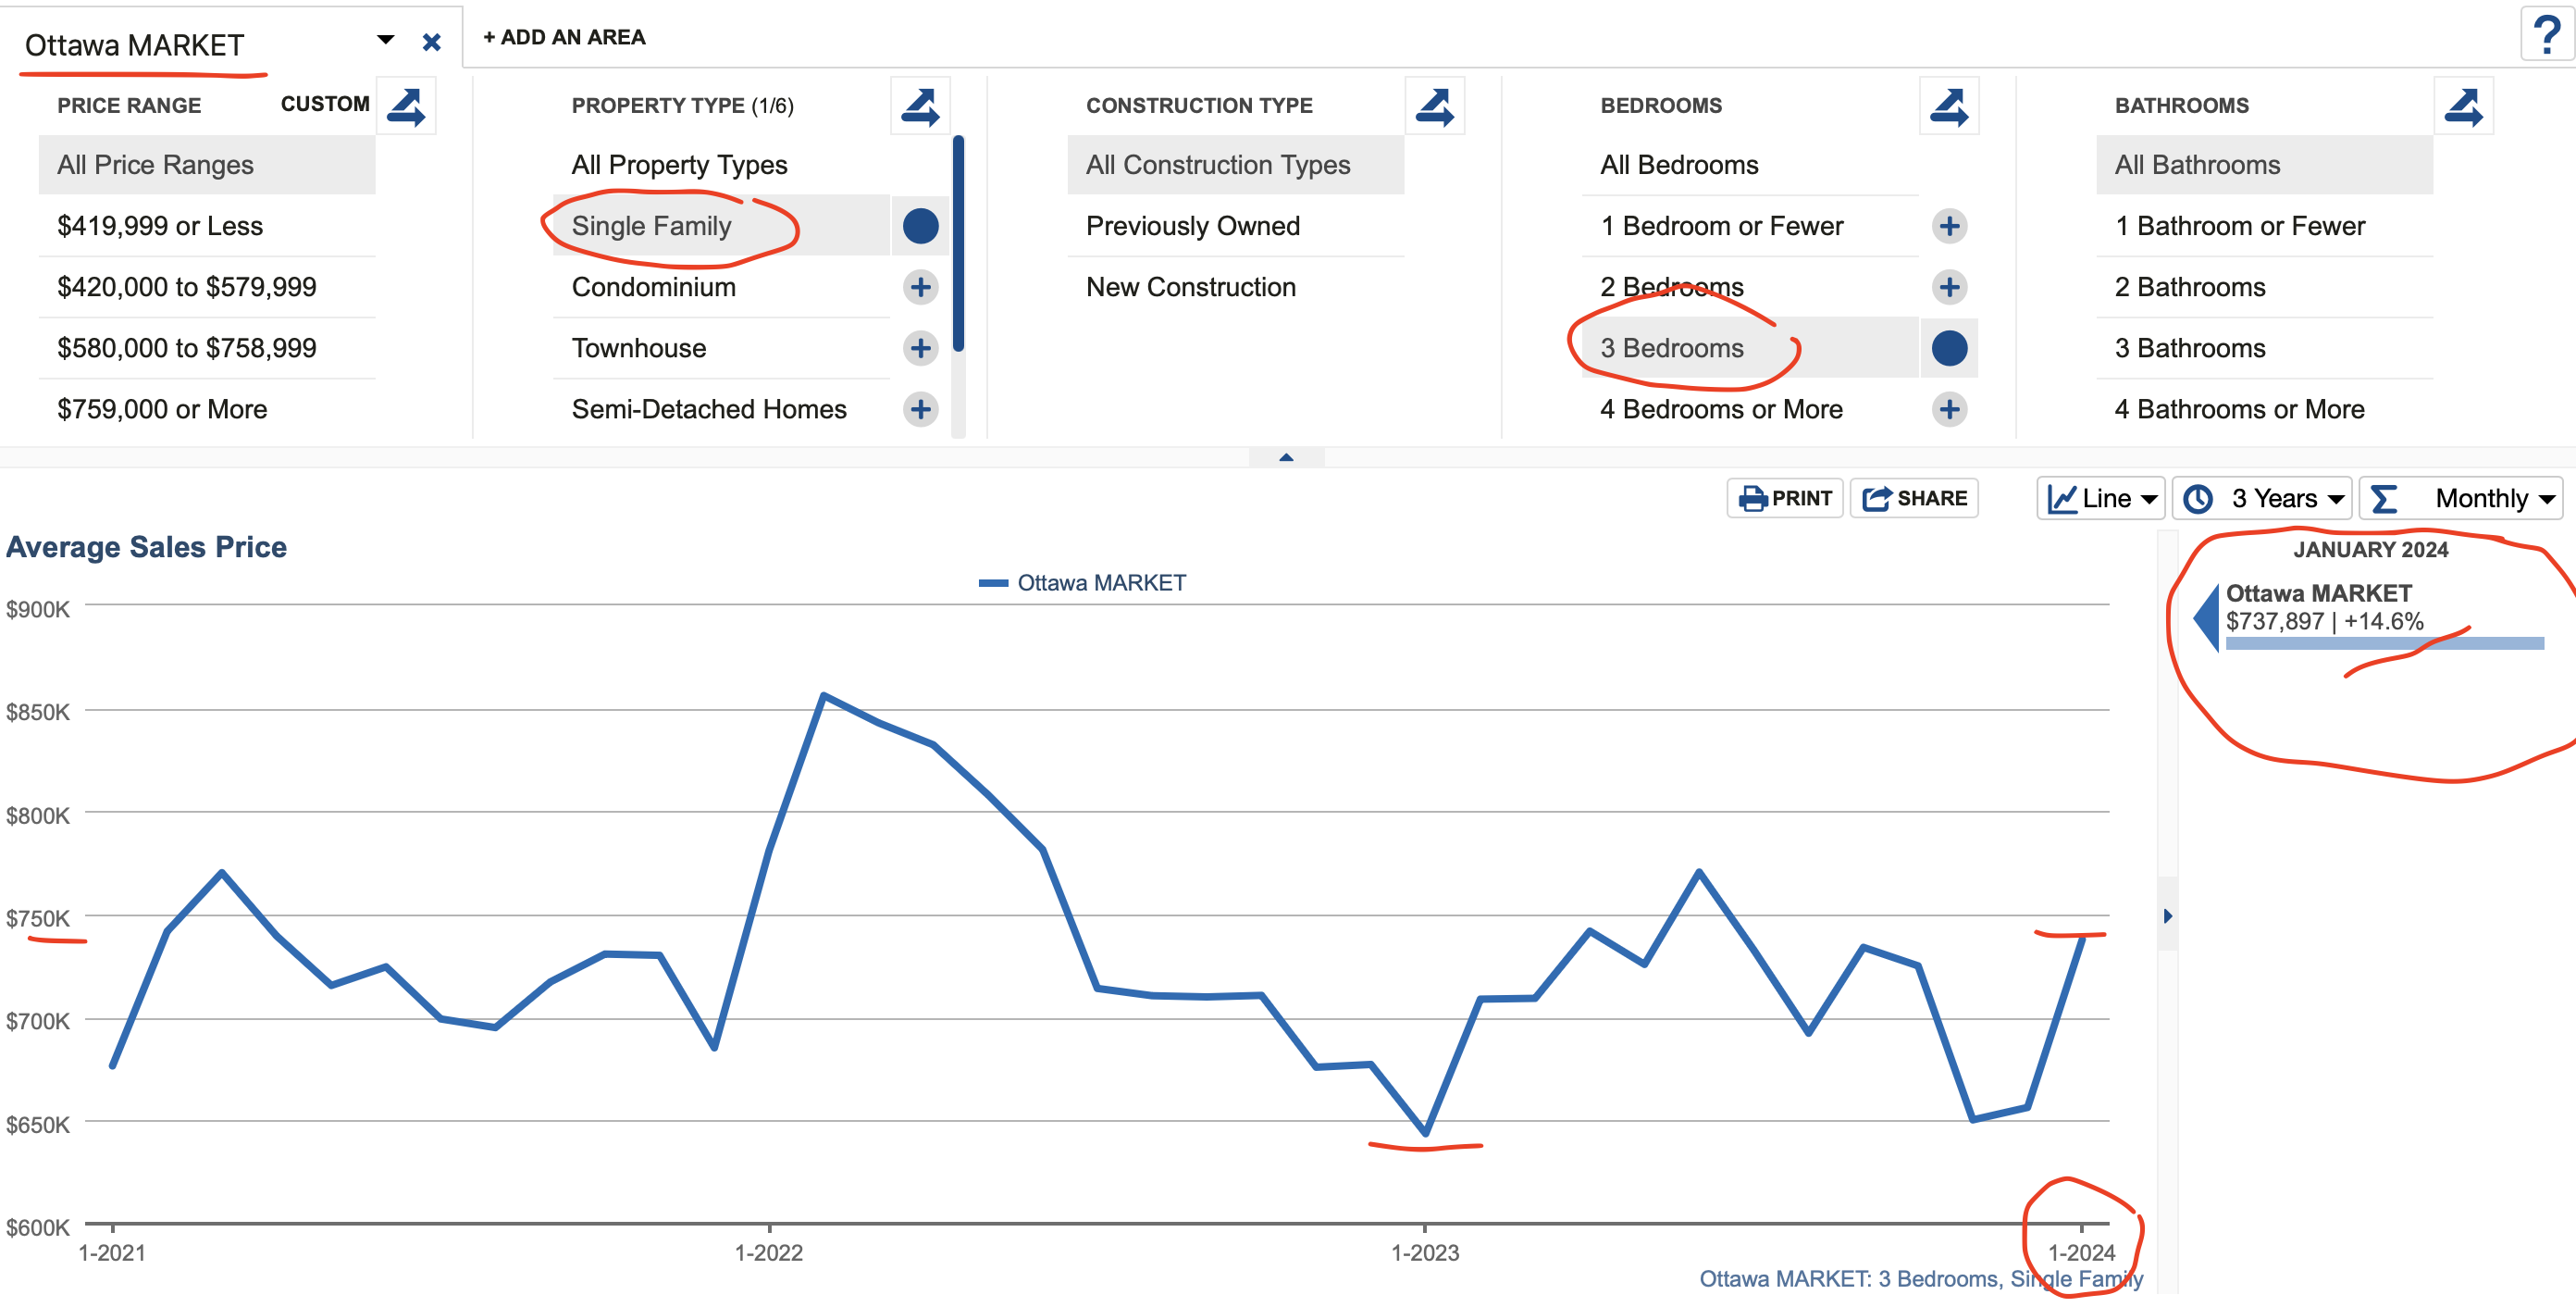
Feb 2024 is a great time to sell
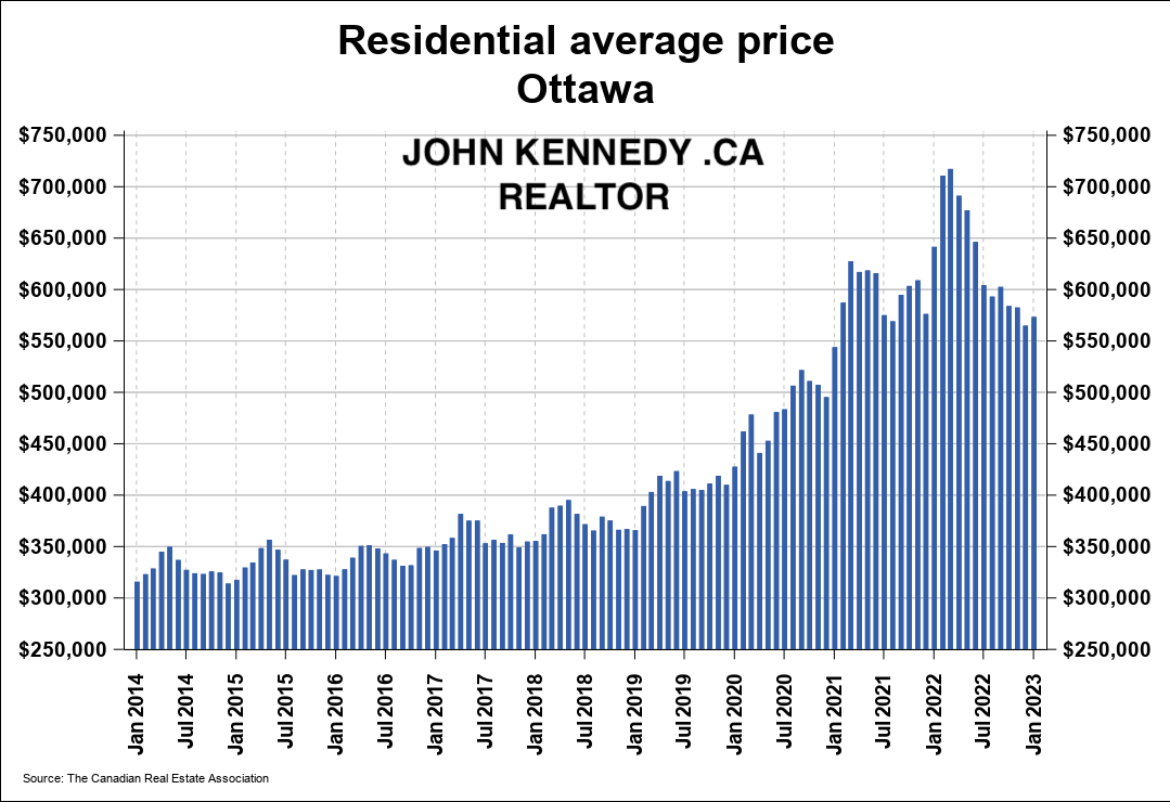
We have just seen a +14% increase since 2023 lowest price. Single family Homes in Ottawa prices Feb 15 2024. Detached 3 bedrooms home just went up +14.6% from 2023 prices.
source: oreb stats


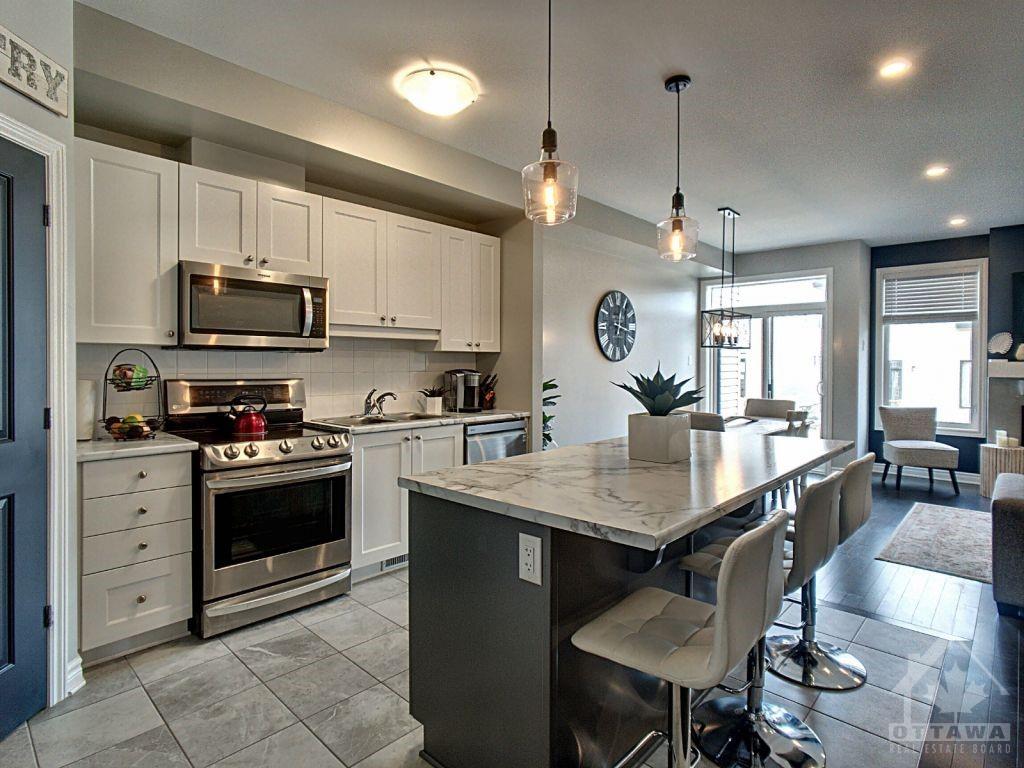
Builder Agreements should include details such as:
PDI – Date
Assignment clause: a must
Evaluation of home value (Appraisal – you should pay for one)
Deposit Structure: Can you get a better deposit structure
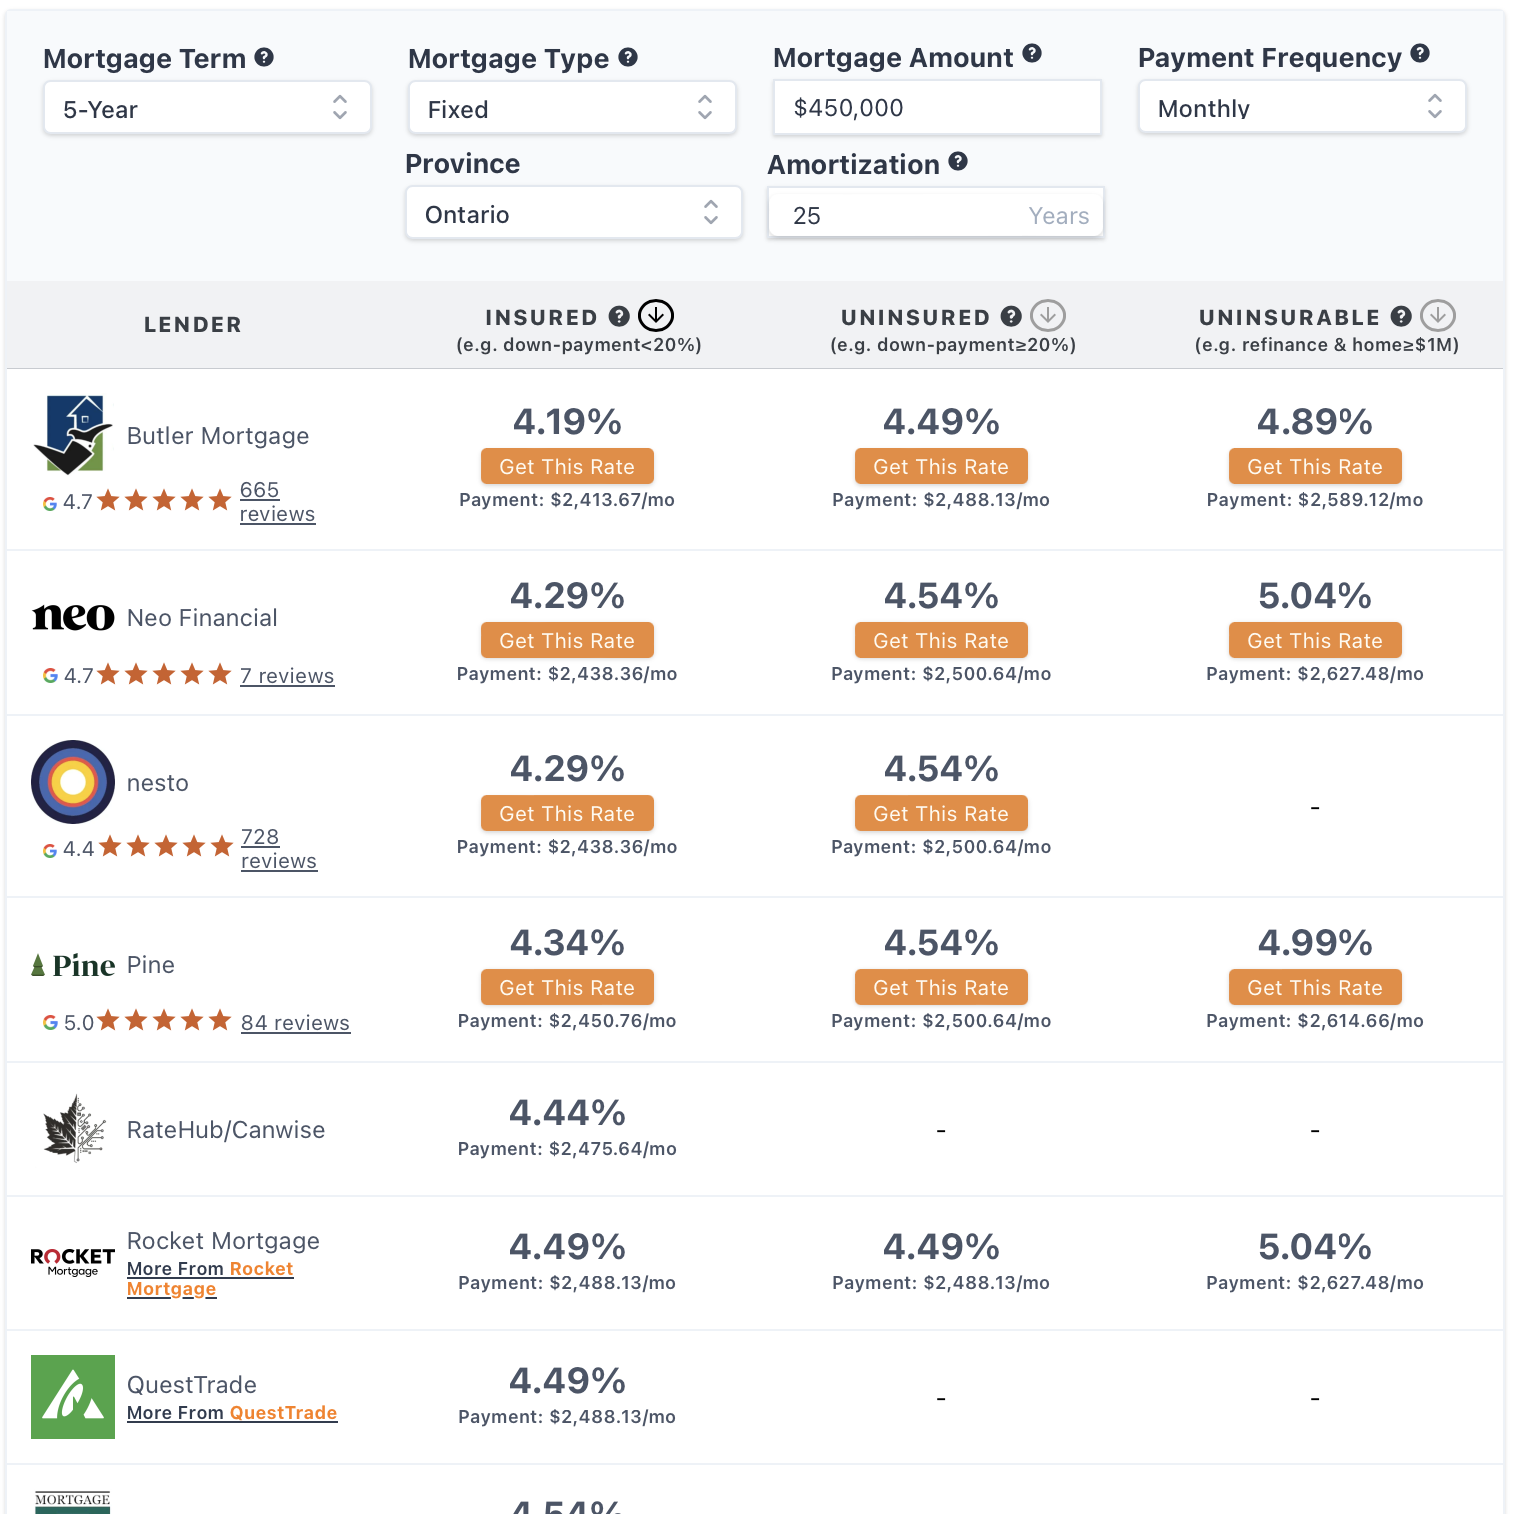
Mortgage approval – a must
Pre-approval – a must
Insurance clause – a must
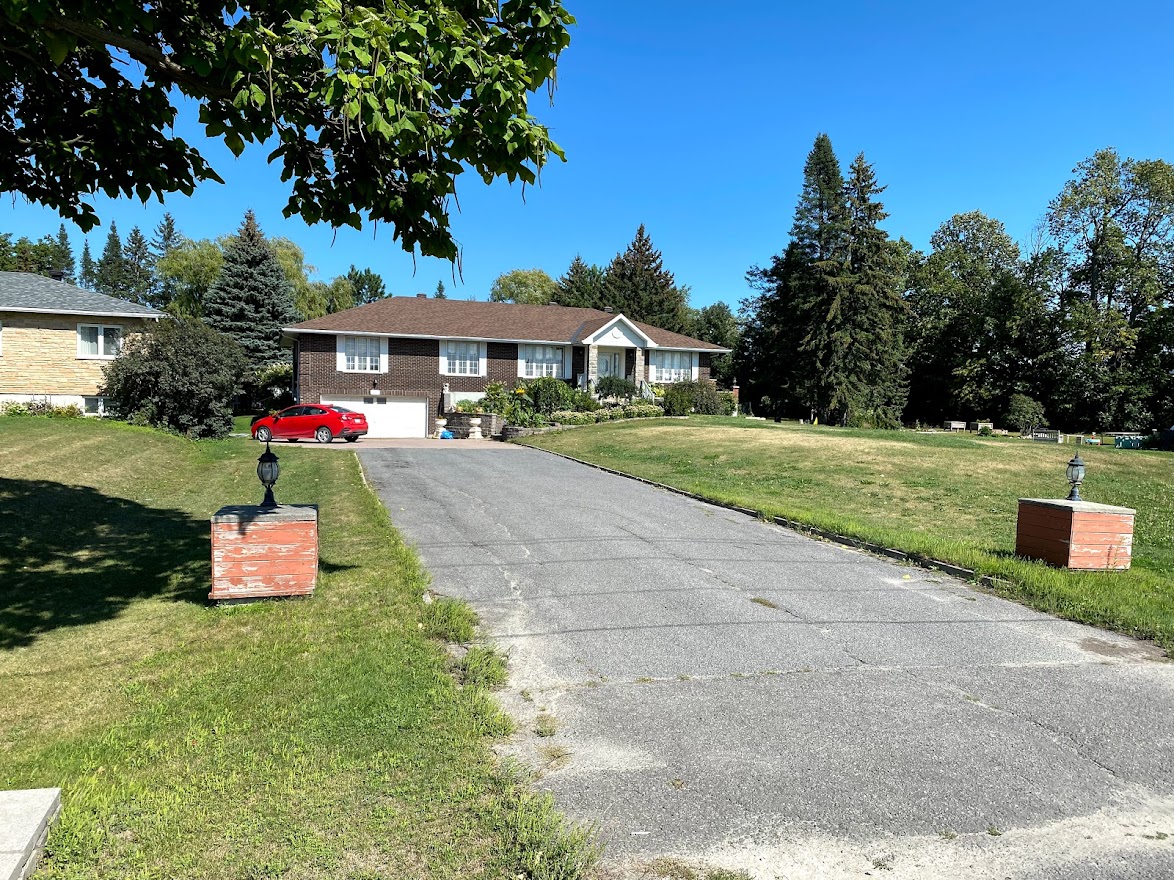
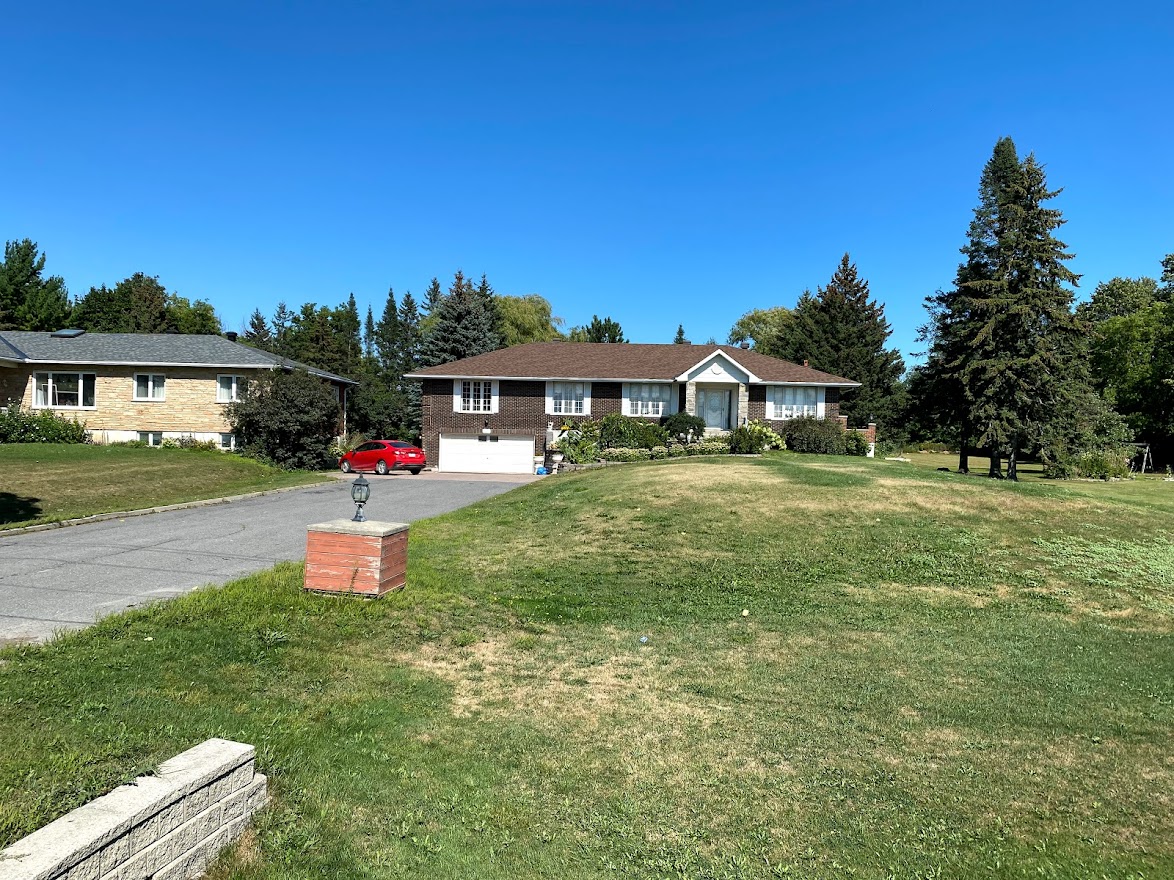
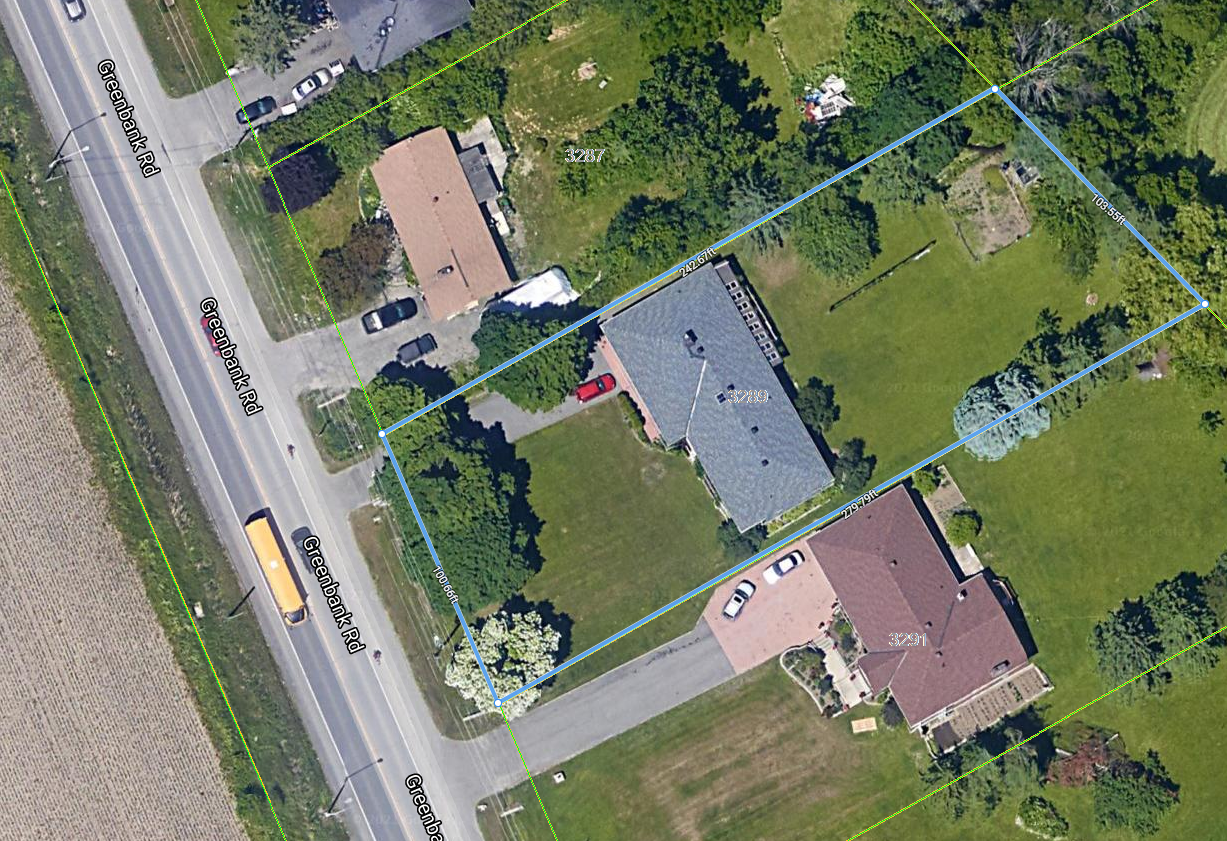
Location:
Flooding topography
Hwy access
Hydro box green
Road T
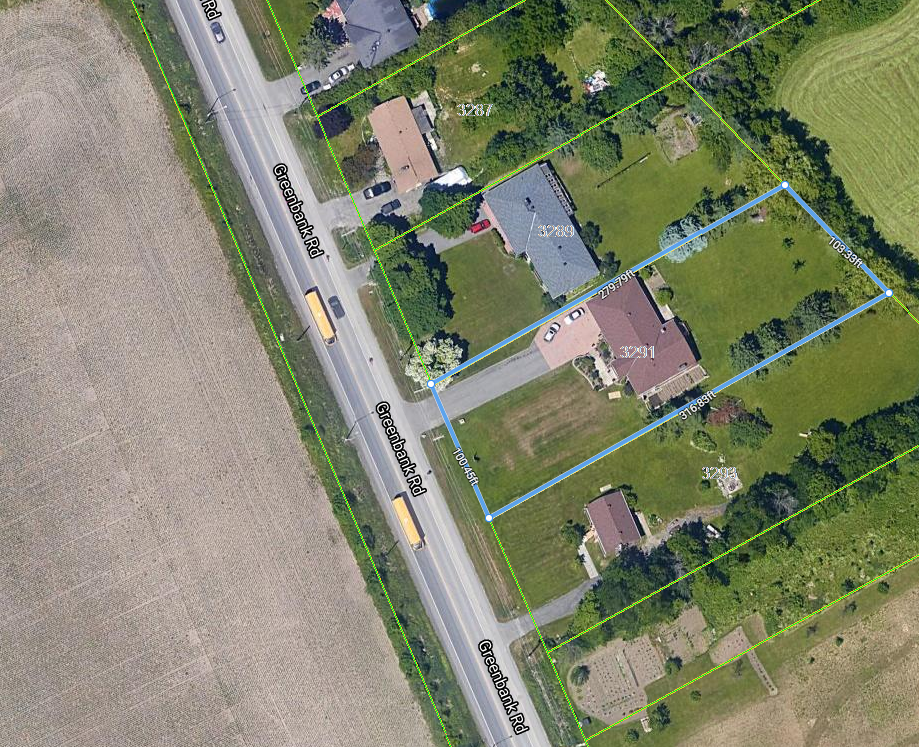
SITE PLAN disclosure – commercial or other future development, check with the city
Backing on to graveyards or other
WHAT FUTURE DEVELOPMENT WILL HAPPEN AROUND THE HOME is very import to value
Shopping close
Schools
Bus stops
Structure:
Model
Sqft cost
List of actual finishes
Design
Floor plan
How long is your Tarion Warranty, and what is under warranty and for how long?
Upgrades list and value $
Builder Insurance coverage
(* for information only – buyers need legal advice or to work with an agent)


September 20th, 2023
Source: OREB
The Ottawa Real Estate Board reported that its members sold 1,196 residential properties in August through the Board’s Multiple Listing Service® (MLS®) System data service, compared with 1,130 in August 2022, an increase of 6%. August’s sales included 903 in the freehold-property class, up 7% from a year ago, and 293 in the condominium-property category, a 2% increase from August 2022. The five-year average for total unit sales in August is 1,525.
“Ottawa Sales activity was up marginally on a year-over-year basis in August but remained well below the historical average for this time of year,” says Ken Dekker, OREB President. “There is no shortage of demand given increased immigration and the large Canadian population cohort entering the market. The lack of suitable, affordable housing is a hindrance. High borrowing costs and economic uncertainty are impacting both sellers and buyers, which we expect will continue to result in further market fluctuations.”

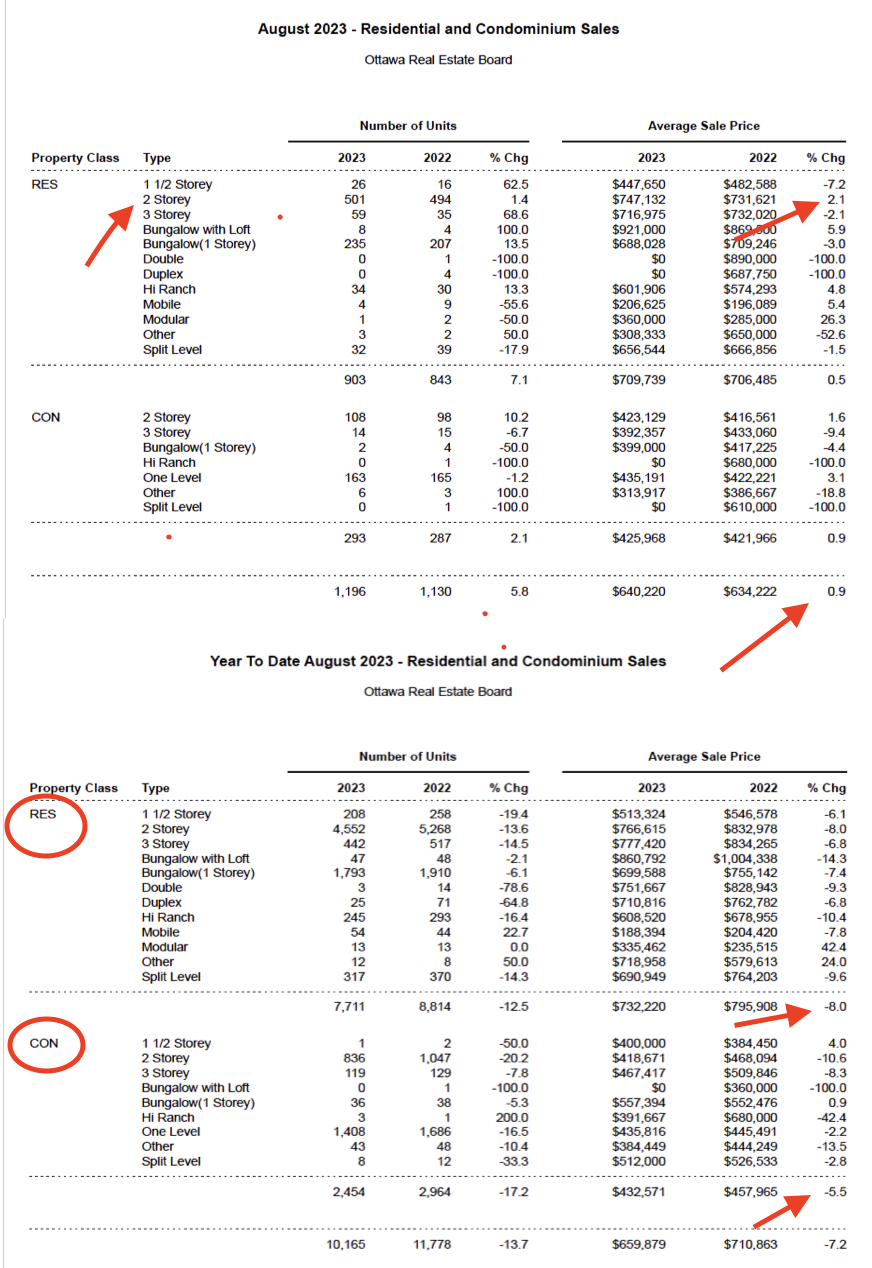
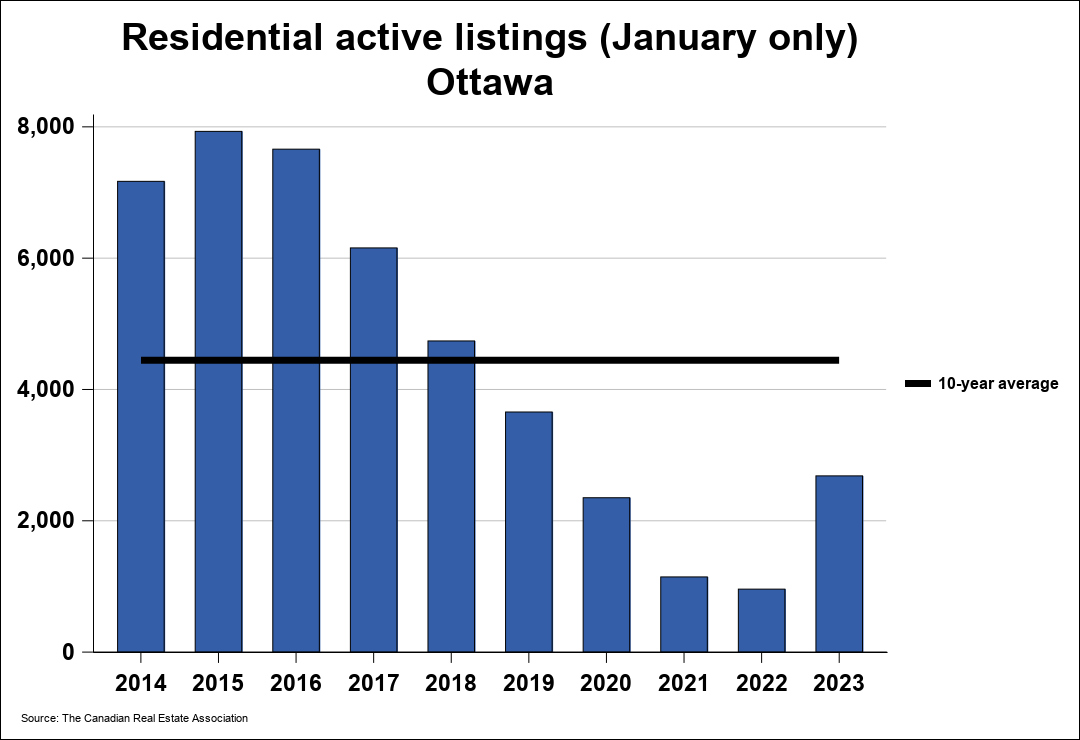
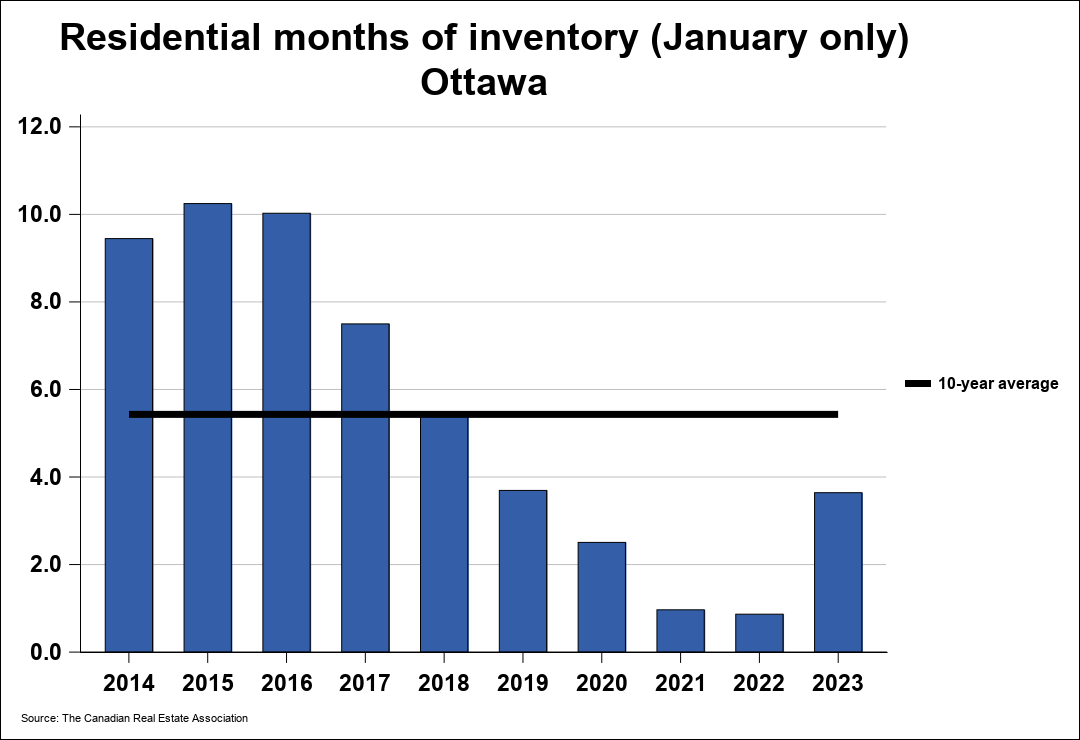
NUMBER OF HOME FOR SALE ARE LOWER THAN OTHER YEARS
IT LOOKS LIKE 2022 AND 2023 HAVE THE SAME AVERAGE SALE PRICE
LOW NUMBER OF LISTINGS, LOW SALE VOLUME 2023

IT LOOKS LIKE WE ARE STILL LOW ON LISTINGS


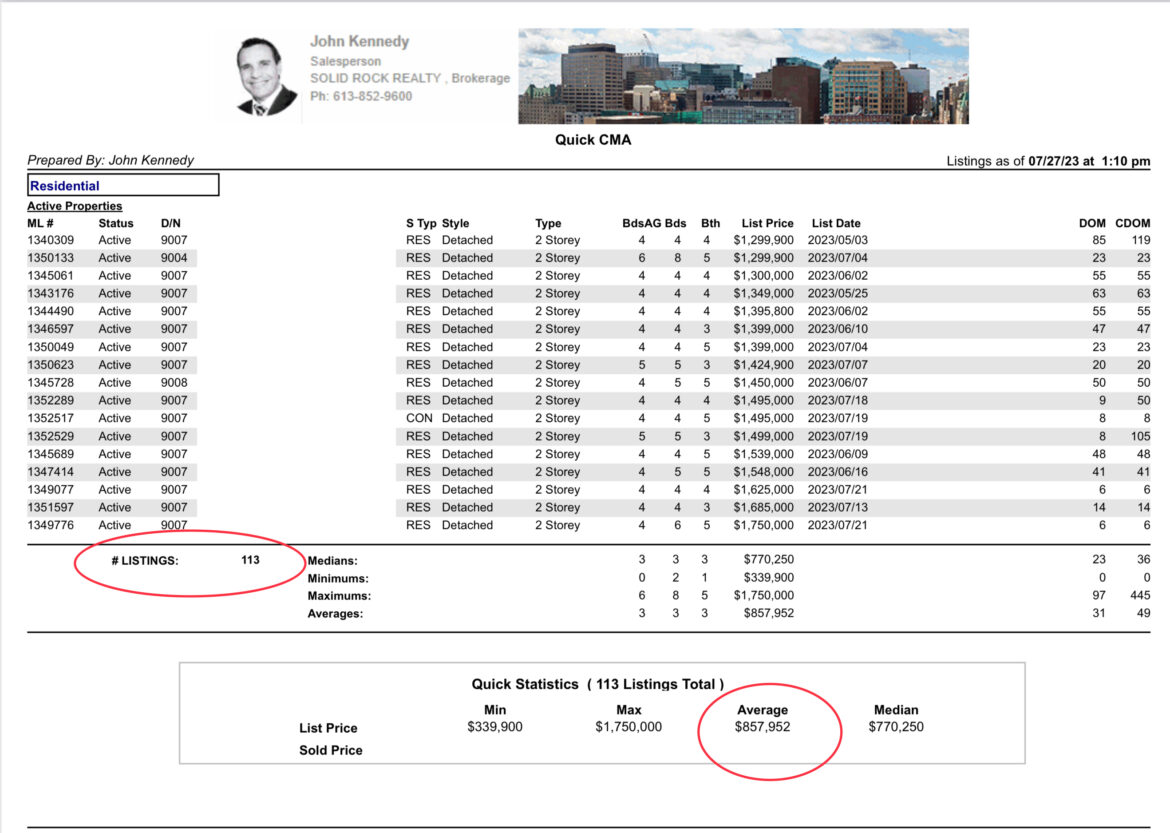
July 27th, 2023
All homes available for sale in Kanata.
Searching for homes for sale in Kanata? Look no further than The KENNEDY Real Estate Team. With several years of experience in selling homes in Kanata. We have extensive knowledge about various models, builders, and neighbourhoods such as: Beaverbrook, Katimavik, Bridlewood, Kanata Lakes, Morgan’s Grant, Trail West, and Elmwood.
In Kanata Ontario, there are several types of dwellings available: Single detached homes, row units townhouses, semi-detached homes, stacked townhouses, and apartments.
We are Currently seeking, 113 listings for sale in Kanata with an average price of approximately:
ALL JULY 2023 DETACHED HOMES AVERAGE PRICE $857,900.
Count on us to provide you with the true value. This free service will ensure you make an informed decision for your next home purchase in Kanata.
ASK FOR OUR FREE “PROPERTY REPORT ON VALUE AND COMPARABLE”.

All Kanata Home Listings on our IDX website.
| ML# | Address | List Price | Type | Style | Bds | Bths |
| 1349274 | 1016 TANGUAY CRT | $339,900 | 2STOREY | STACK | 2 | 2 |
| 1346861 | 1006 TANGUAY CRT | $349,900 | 2STOREY | STACK | 2 | 2 |
| 1347644 | 103 SALTER CRES | $379,900 | 2STOREY | ROW | 3 | 2 |
| 1353521 | 239 PICKFORD DR | $429,900 | 2STOREY | ROW | 3 | 2 |
| 1352685 | 21 BEST WAY | $438,000 | 2STOREY | ROW | 3 | 3 |
| 1345297 | 2033 CAMPEAU DR | $449,000 | 2STOREY | STACK | 2 | 2 |
| 1347915 | 300 TULUM CRES #H | $485,000 | 1LEVEL | STACK | 2 | 1 |
| 1339787 | 310 TULUM CRES #C | $499,900 | OTHER | STACK | 2 | 2 |
| 1339789 | 310 TULUM CRES #B | $499,900 | OTHER | STACK | 2 | 2 |
| 1349944 | 106 KINCARDINE DR | $516,000 | 2STOREY | ROW | 2 | 3 |
| 1344162 | 598 FOXLIGHT CIR | $528,900 | 3STOREY | ROW | 2 | 3 |
| 1352430 | 373 HILLSBORO PVT | $534,900 | 2STOREY | ROW | 3 | 3 |
| 1353245 | 21 STREAMBANK ST | $539,900 | 3STOREY | ROW | 2 | 2 |
| 1351777 | 516 ABERFOYLE CIR | $549,900 | 2STOREY | ROW | 3 | 2 |
| 1351967 | 1505 CAMPEAU DR | $549,999 | 2STOREY | STACK | 2 | 3 |
| 1351412 | 14 MEADOWBREEZE DR | $550,000 | 2STOREY | ROW | 3 | 3 |
| 1351319 | 29 STREAMBANK ST | $558,000 | 3STOREY | ROW | 3 | 2 |
| 1352962 | 127 ATTWELL PVT | $559,900 | 3STOREY | ROW | 2 | 3 |
| 1350428 | 161 ATTWELL PVT | $569,000 | 3STOREY | ROW | 2 | 2 |
| 1338221 | 398 HILLSBORO PVT | $569,900 | 2STOREY | ROW | 3 | 3 |
| 1350177 | 63 SPRINGCREEK CRES | $575,000 | 2STOREY | ROW | 3 | 2 |
| 1351338 | 4 SUNNYBROOKE DR | $575,000 | 2STOREY | ROW | 3 | 2 |
| 1351016 | 60 HELMSDALE DR | $599,900 | 2STOREY | ROW | 3 | 3 |
| 1351828 | 833 TABARET ST | $618,000 | 2STOREY | ROW | 3 | 3 |
| 1353591 | 586 BARRICK HILL RD | $619,900 | 2STOREY | ROW | 3 | 3 |
| 1353394 | 1326 HALTON TERR | $625,000 | 2STOREY | ROW | 3 | 3 |
| 1349339 | 738 OAKGLADE AVE | $629,900 | 2STOREY | ROW | 3 | 3 |
| 1352422 | 220 FORESTBROOK ST | $639,000 | 2STOREY | ROW | 3 | 3 |
| 1351156 | 94 SADDLESMITH CIR | $639,000 | 2STOREY | ROW | 3 | 3 |
| 1352406 | 201 OPUS ST | $649,900 | 2STOREY | ROW | 3 | 3 |
| 1352958 | 80 ROBARTS CRES | $649,900 | 2STOREY | ROW | 3 | 4 |
| 1352924 | 276 MAXWELL BRIDGE RD | $649,900 | 2STOREY | ROW | 3 | 3 |
| 1346702 | 30 HIGHMONT CRT | $650,000 | 2STOREY | SEMIDET | 3 | 3 |
| 1353652 | 29 COURTNEY RD | $654,900 | BUNGLOW | DETACH | 4 | 2 |
| 1346498 | 218 HUNTERBROOK ST N | $659,999 | 2STOREY | ROW | 3 | 3 |
| 1346233 | 100 PATRIOT PL | $669,900 | 2STOREY | ROW | 3 | 3 |
| 1350846 | 560 PEPPERVILLE CRES | $669,900 | 2STOREY | ROW | 3 | 3 |
| 1350828 | 120 SPRINGCREEK CRES | $674,900 | 2STOREY | DETACH | 3 | 2 |
| 1340559 | 804 STAR PVT | $684,900 | 3STOREY | ROW | 2 | 4 |
| 1343773 | 31 BACHMAN TERR | $694,900 | 3STOREY | ROW | 2 | 4 |
| 1342872 | 58 BLACKDOME CRES | $699,000 | 2STOREY | ROW | 3 | 2 |
| 1351794 | 7 CURRAN ST | $699,000 | 2STOREY | DETACH | 3 | 2 |
| 1347144 | 80 GOLDRIDGE DR | $699,900 | 2STOREY | ROW | 3 | 3 |
| 1350013 | 70 MERSEY AVE | $699,900 | 2STOREY | DETACH | 3 | 3 |
| 1343158 | 27 BACHMAN TERR | $704,900 | 3STOREY | ROW | 4 | 4 |
| 1345027 | 45 BACHMAN TERR | $714,900 | 3STOREY | ROW | 3 | 3 |
| 1344899 | 110 MACASSA CIR | $724,900 | SPLIT | ROW | 3 | 3 |
| 1348075 | 51 WATERTHRUSH CRES | $724,900 | BUNGLOW | SEMIDET | 3 | 3 |
| 1333567 | 69 EQUESTRIAN DR | $729,900 | 2STOREY | DETACH | 3 | 3 |
| 1344890 | 37 BACHMAN TERR | $734,900 | 3STOREY | ROW | 4 | 4 |
| 1350053 | 993 KLONDIKE RD | $735,000 | 2STOREY | ROW | 3 | 3 |
| 1339680 | 432 MEADOWBREEZE DR | $739,900 | 2STOREY | ROW | 4 | 3 |
| 1349133 | 283 KINGHAVEN CRES | $749,000 | 2STOREY | ROW | 3 | 4 |
| 1347577 | 95 VILLAGE GREEN | $749,999 | 2STOREY | DETACH | 4 | 2 |
| 1345492 | 21 WESTMEATH CRES | $757,000 | 2STOREY | DETACH | 3 | 3 |
| 1352433 | 2 SEWELL WAY | $769,900 | 2STOREY | DETACH | 4 | 3 |
| 1348719 | 554 HITZLAY CRES | $770,250 | 2STOREY | ROW | 3 | 3 |
| 1352974 | 66 MACASSA CIR | $790,000 | 3STOREY | ROW | 2 | 3 |
| 1352026 | 42 FOULIS CRES | $794,000 | BUNGLOW | ROW | 3 | 3 |
| 1348104 | 4 TURNBULL AVE | $799,900 | 2STOREY | DETACH | 3 | 3 |
| 1351607 | 26 FOXLEIGH CRES | $799,900 | 2STOREY | DETACH | 4 | 4 |
| 1353089 | 33 SPUR AVE | $799,900 | 2STOREY | DETACH | 4 | 4 |
| 1353349 | 58 BRIDLE PARK DR | $799,900 | 2STOREY | DETACH | 4 | 3 |
| 1347391 | 182 OVERBERG WAY | $809,900 | 2STOREY | ROW | 3 | 4 |
| 1352046 | 194 FLOWING CREEK CIR | $829,900 | 2STOREY | DETACH | 4 | 4 |
| 1348237 | 65 CROWNRIDGE DR | $839,900 | 2STOREY | DETACH | 3 | 3 |
| 1352949 | 24 RIVERGREEN CRES | $839,900 | 2STOREY | DETACH | 3 | 3 |
| 1352972 | 140 BRIDGESTONE DR | $849,900 | 2STOREY | DETACH | 4 | 3 |
| 1339798 | 819 PETRA PVT | $850,000 | 3STOREY | ROW | 3 | 4 |
| 1352306 | 135 SOLARIS DR | $855,000 | 2STOREY | DETACH | 4 | 4 |
| 1351387 | 441 TILLSONBURG ST | $875,000 | 2STOREY | DETACH | 3 | 3 |
| 1350782 | 122 WHERNSIDE TERR | $885,000 | 2STOREY | DETACH | 4 | 4 |
| 1353183 | 2 BRADLEY FARM CRT | $899,900 | 2STOREY | DETACH | 4 | 4 |
| 1346499 | 4 BRADLEY FARM CRT | $899,999 | 2STOREY | DETACH | 6 | 4 |
| 1348913 | 26 PELLAN CRES N | $936,000 | 2STOREY | DETACH | 4 | 3 |
| 1348723 | 15 RUTHERFORD CRES | $945,000 | 2STOREY | DETACH | 4 | 3 |
| 1346322 | 803 OAKSIDE CRES | $959,000 | 2STOREY | DETACH | 5 | 4 |
| 1348720 | 360 ABBEYDALE CIR | $969,900 | 2STOREY | DETACH | 4 | 3 |
| 1346305 | 614 BRIDLEGLEN CRES | $979,990 | 2STOREY | DETACH | 3 | 3 |
| 1330947 | 27 SOLARIS DR | $989,900 | 2STOREY | DETACH | 4 | 4 |
| 1350083 | 19 RUTHERFORD CRES | $989,900 | 2STOREY | DETACH | 4 | 4 |
| 1342008 | 42 STONECROFT TERR | $998,000 | BUNGLOW | DETACH | 4 | 3 |
| 1346782 | 178 GYRFALCON CRES | $999,000 | 2STOREY | DETACH | 5 | 4 |
| 1347064 | 11 TURTLE POINT PVT | $999,000 | BGWL | ROW | 4 | 4 |
| 1347484 | 2004 ALLEGRINI TERR | $999,900 | 2STOREY | DETACH | 4 | 3 |
| 1343628 | 343 SUGAR PINE CRES | $1,029,000 | 2STOREY | DETACH | 3 | 3 |
| 1350372 | 10 JARLAN TERR | $1,039,000 | 2STOREY | DETACH | 4 | 3 |
| 1346589 | 11 MENDOZA WAY | $1,049,000 | 2STOREY | DETACH | 4 | 3 |
| 1352264 | 328 LAUGHLIN CIR | $1,050,000 | 2STOREY | DETACH | 4 | 3 |
| 1345277 | 8 EVANSHEN CRES | $1,100,000 | 2STOREY | DETACH | 4 | 3 |
| 1350338 | 26 VARLEY DR | $1,150,000 | 2STOREY | DETACH | 4 | 3 |
| 1349314 | 9 ROSETHORN WAY | $1,188,800 | 2STOREY | DETACH | 5 | 4 |
| 1345120 | 138 STEEPLE CHASE DR | $1,199,900 | 2STOREY | DETACH | 4 | 4 |
| 1350186 | 36 ROSENFELD CRES | $1,225,000 | 2STOREY | DETACH | 4 | 4 |
| 1340309 | 123 GRAINSTONE WAY | $1,299,900 | 2STOREY | DETACH | 4 | 4 |
| 1350133 | 50 OSPREY CRES | $1,299,900 | 2STOREY | DETACH | 8 | 5 |
| 1345061 | 28 GREENSAND PL | $1,300,000 | 2STOREY | DETACH | 4 | 4 |
| 1343176 | 396 HUNTSVILLE DR | $1,349,000 | 2STOREY | DETACH | 4 | 4 |
| 1344490 | 250 KETCHIKAN CRES | $1,395,800 | 2STOREY | DETACH | 4 | 4 |
| 1346597 | 55 IRONSIDE CRT | $1,399,000 | 2STOREY | DETACH | 4 | 3 |
| 1350049 | 523 BRECCIA HTS | $1,399,000 | 2STOREY | DETACH | 4 | 5 |
| 1350623 | 139 INGERSOLL CRES | $1,424,900 | 2STOREY | DETACH | 5 | 3 |
| 1345728 | 348 ABBEYDALE CIR | $1,450,000 | 2STOREY | DETACH | 5 | 5 |
| 1352289 | 60 ROSENFELD CRES | $1,495,000 | 2STOREY | DETACH | 4 | 4 |
| 1352517 | 15 KANATA ROCKERIES PVT | $1,495,000 | 2STOREY | DETACH | 4 | 5 |
| 1352529 | 65 IRONSIDE CRT | $1,499,000 | 2STOREY | DETACH | 5 | 3 |
| 1345689 | 1098 BLANDING ST | $1,539,000 | 2STOREY | DETACH | 4 | 5 |
| 1347414 | 525 BRECCIA HTS | $1,548,000 | 2STOREY | DETACH | 5 | 5 |
| 1349077 | 44 IRONSIDE CRT | $1,625,000 | 2STOREY | DETACH | 4 | 4 |
| 1351597 | 3 GOULDING CRES | $1,685,000 | 2STOREY | DETACH | 4 | 3 |
| 1349776 | 65 WALDEN DR | $1,750,000 | 2STOREY | DETACH | 6 | 5 |
Count on us to provide you with the true value. This free service will ensure you make an informed decision for your next home purchase in Kanata.
ASK FOR OUR FREE “PROPERTY REPORT ON VALUE AND COMPARABLE”.


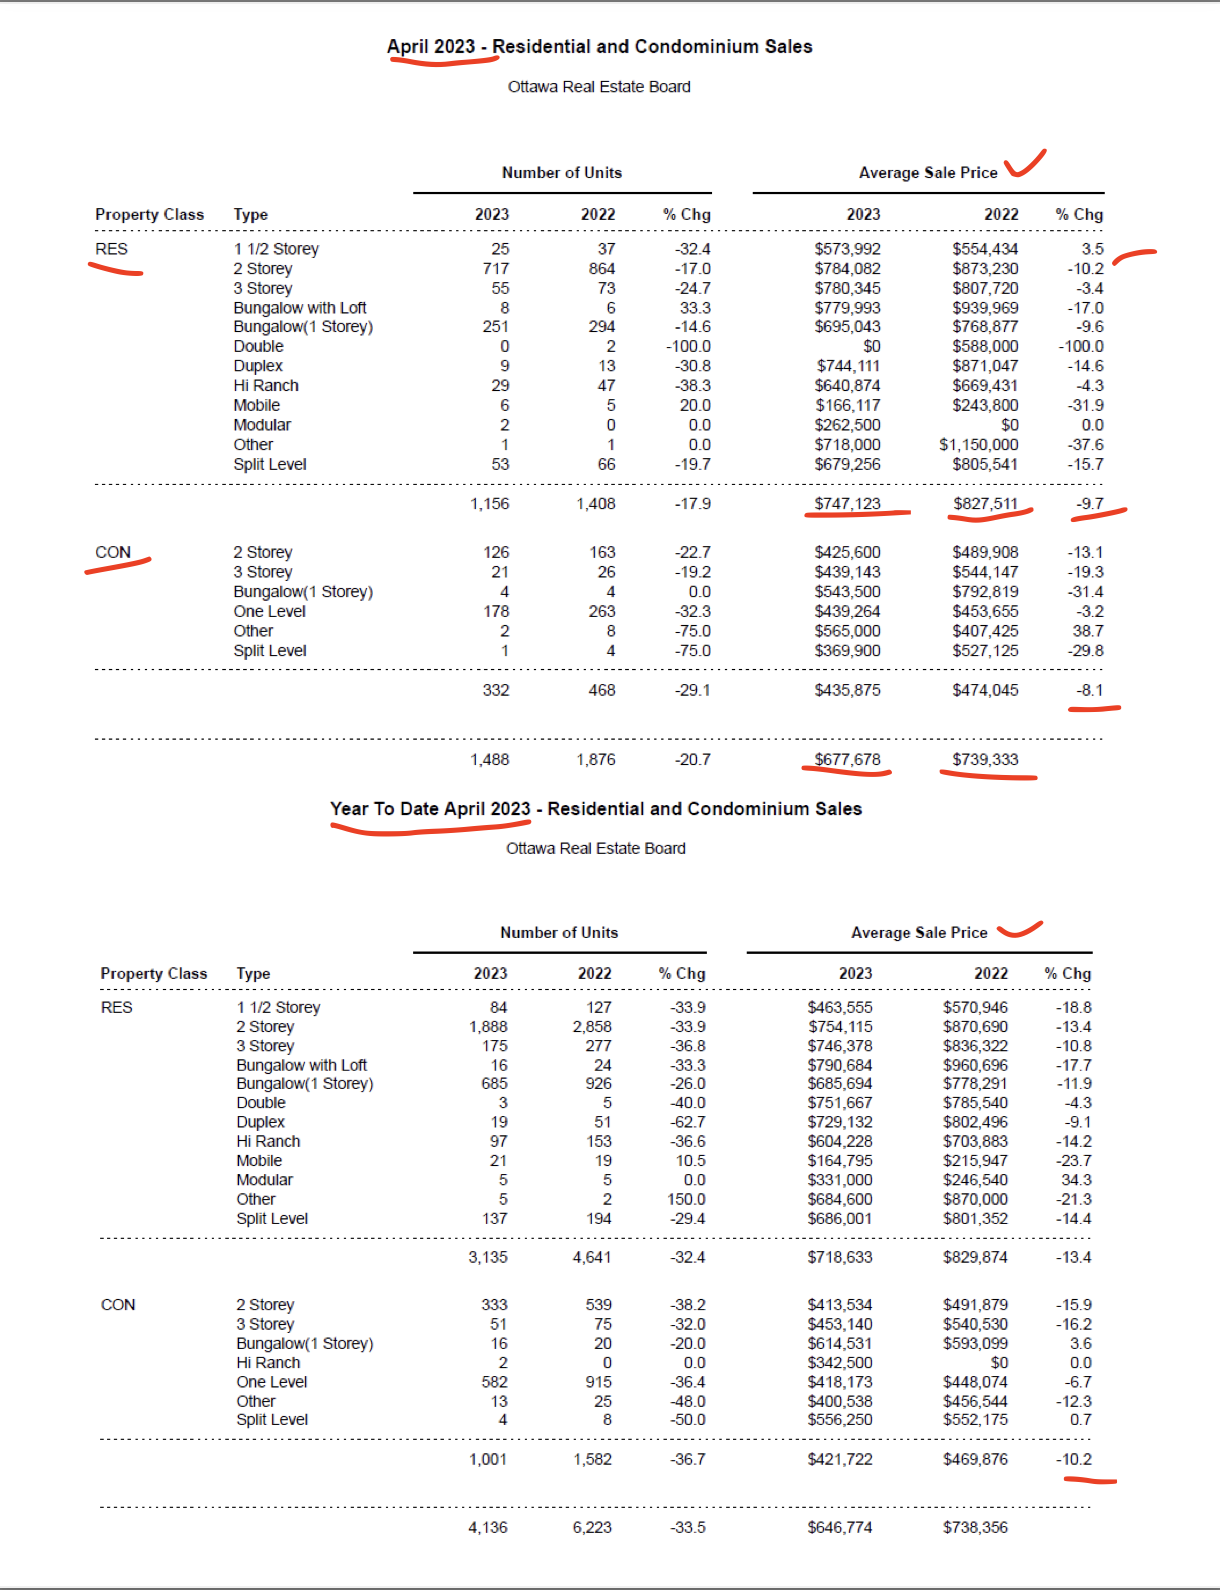
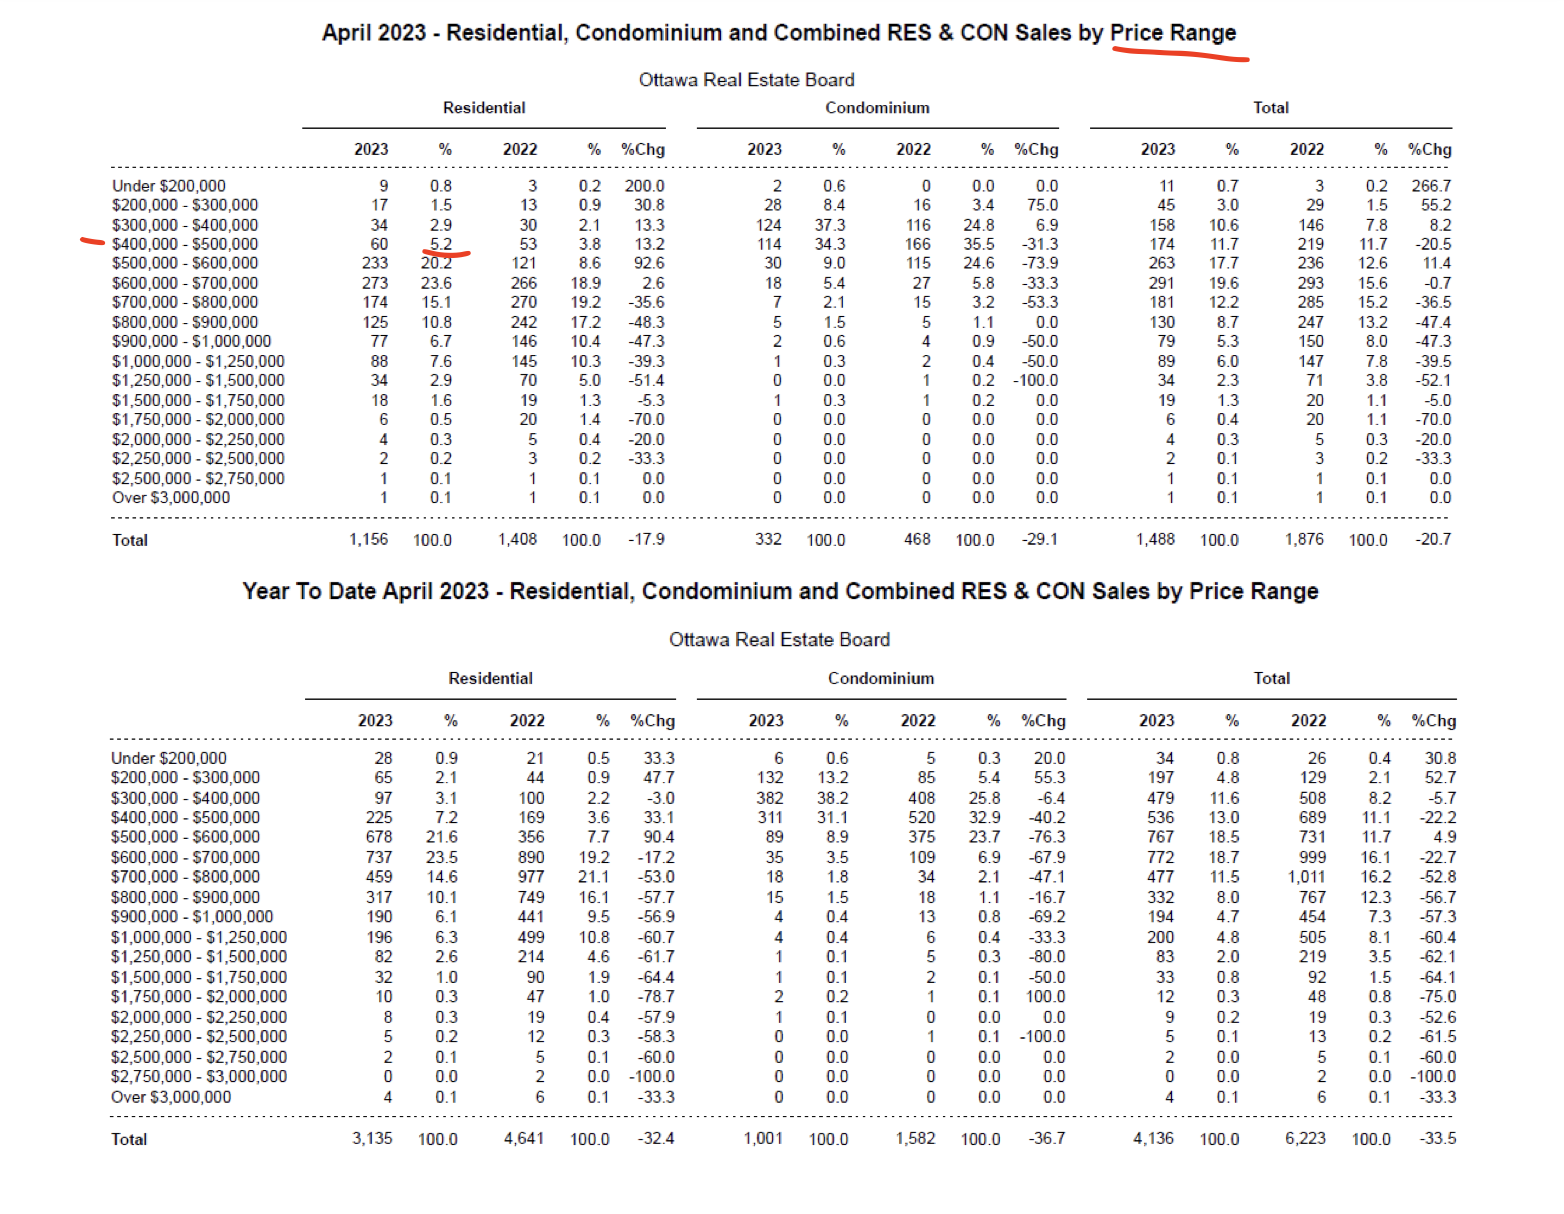
MAY 3, 2023
Source: OREB
May 2023, Ottawa Real estate Market update.
NUMBERS SOLD: The members Ottawa Real Estate Board (OREB) sold 1,488 residential properties in April through the Board’s Multiple Listing Service® (MLS®) System, compared with 1,876 in April 2022, a decrease of 21%.
SALES NUMBERS DOWN: Sales included 1,156 in the freehold-property class, down 18% from a year ago, and 332 in the condominium-property category, a decrease of 29% from April 2022. The five-year average for total unit sales in April is 1,739.
RESALE UPWARD TREND: “Ottawa’s resale market is on a steady upward trajectory, narrowing the comparison gap to peak pandemic activity in 2022.
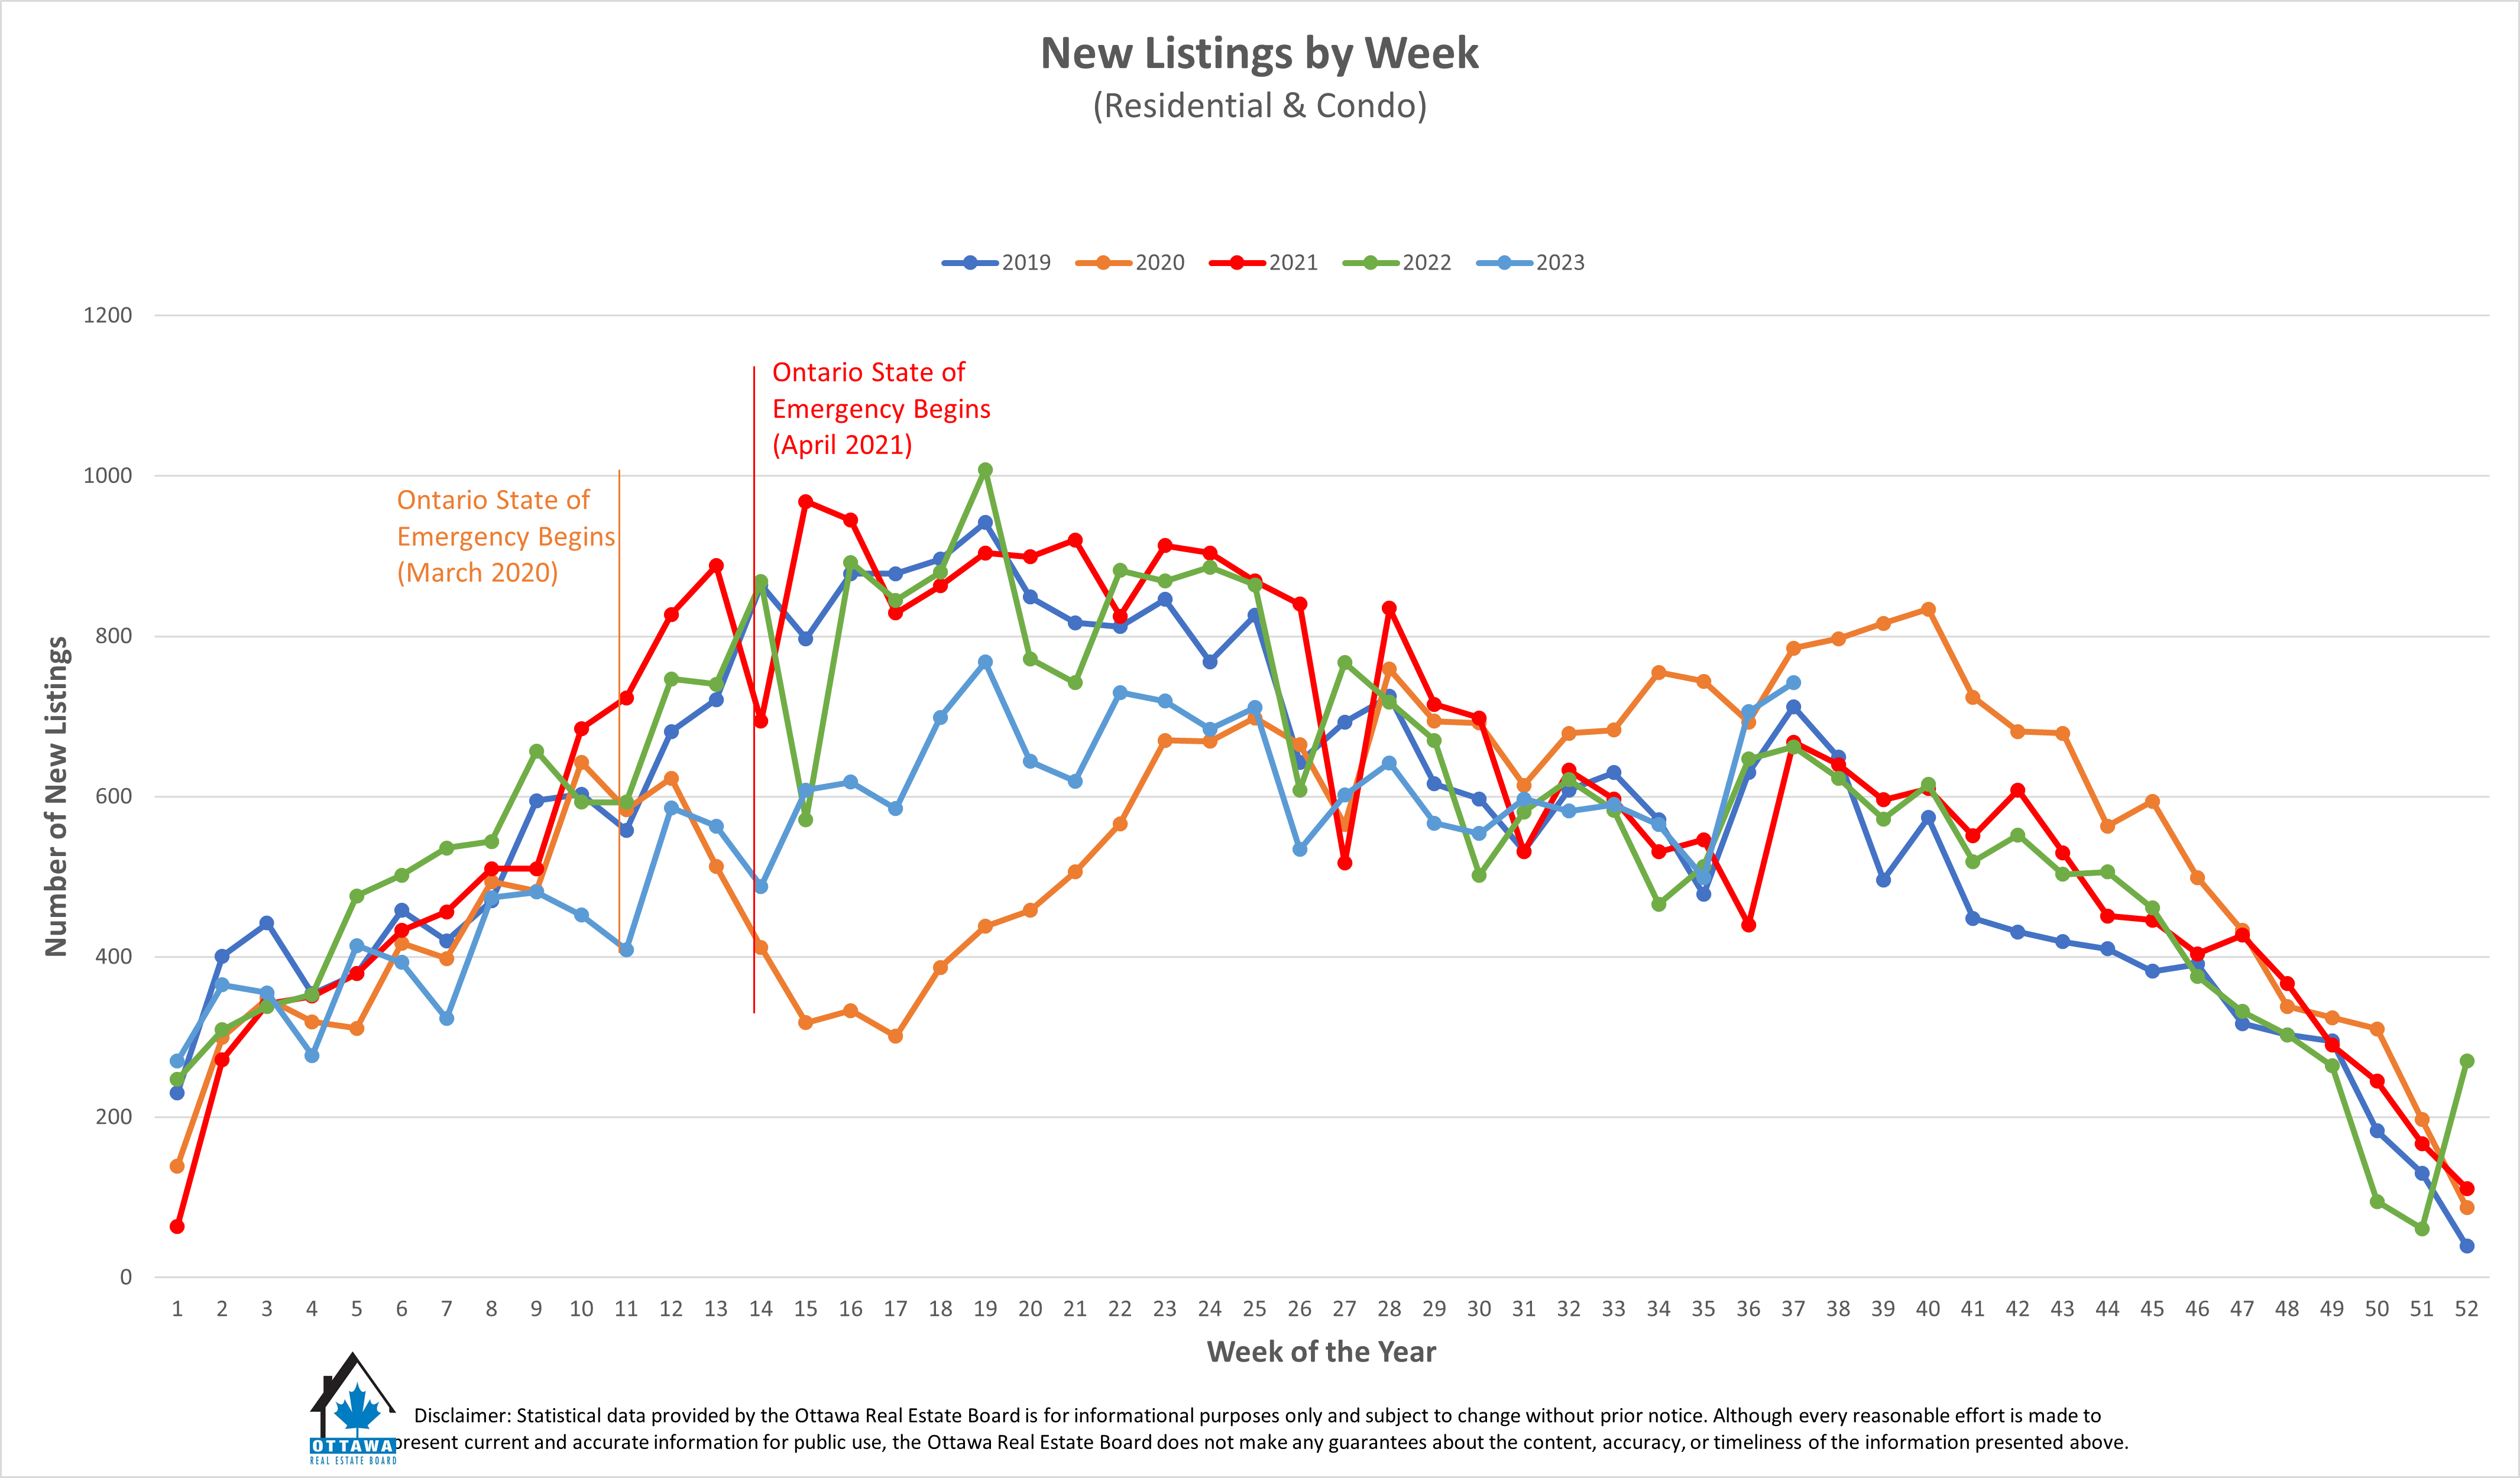
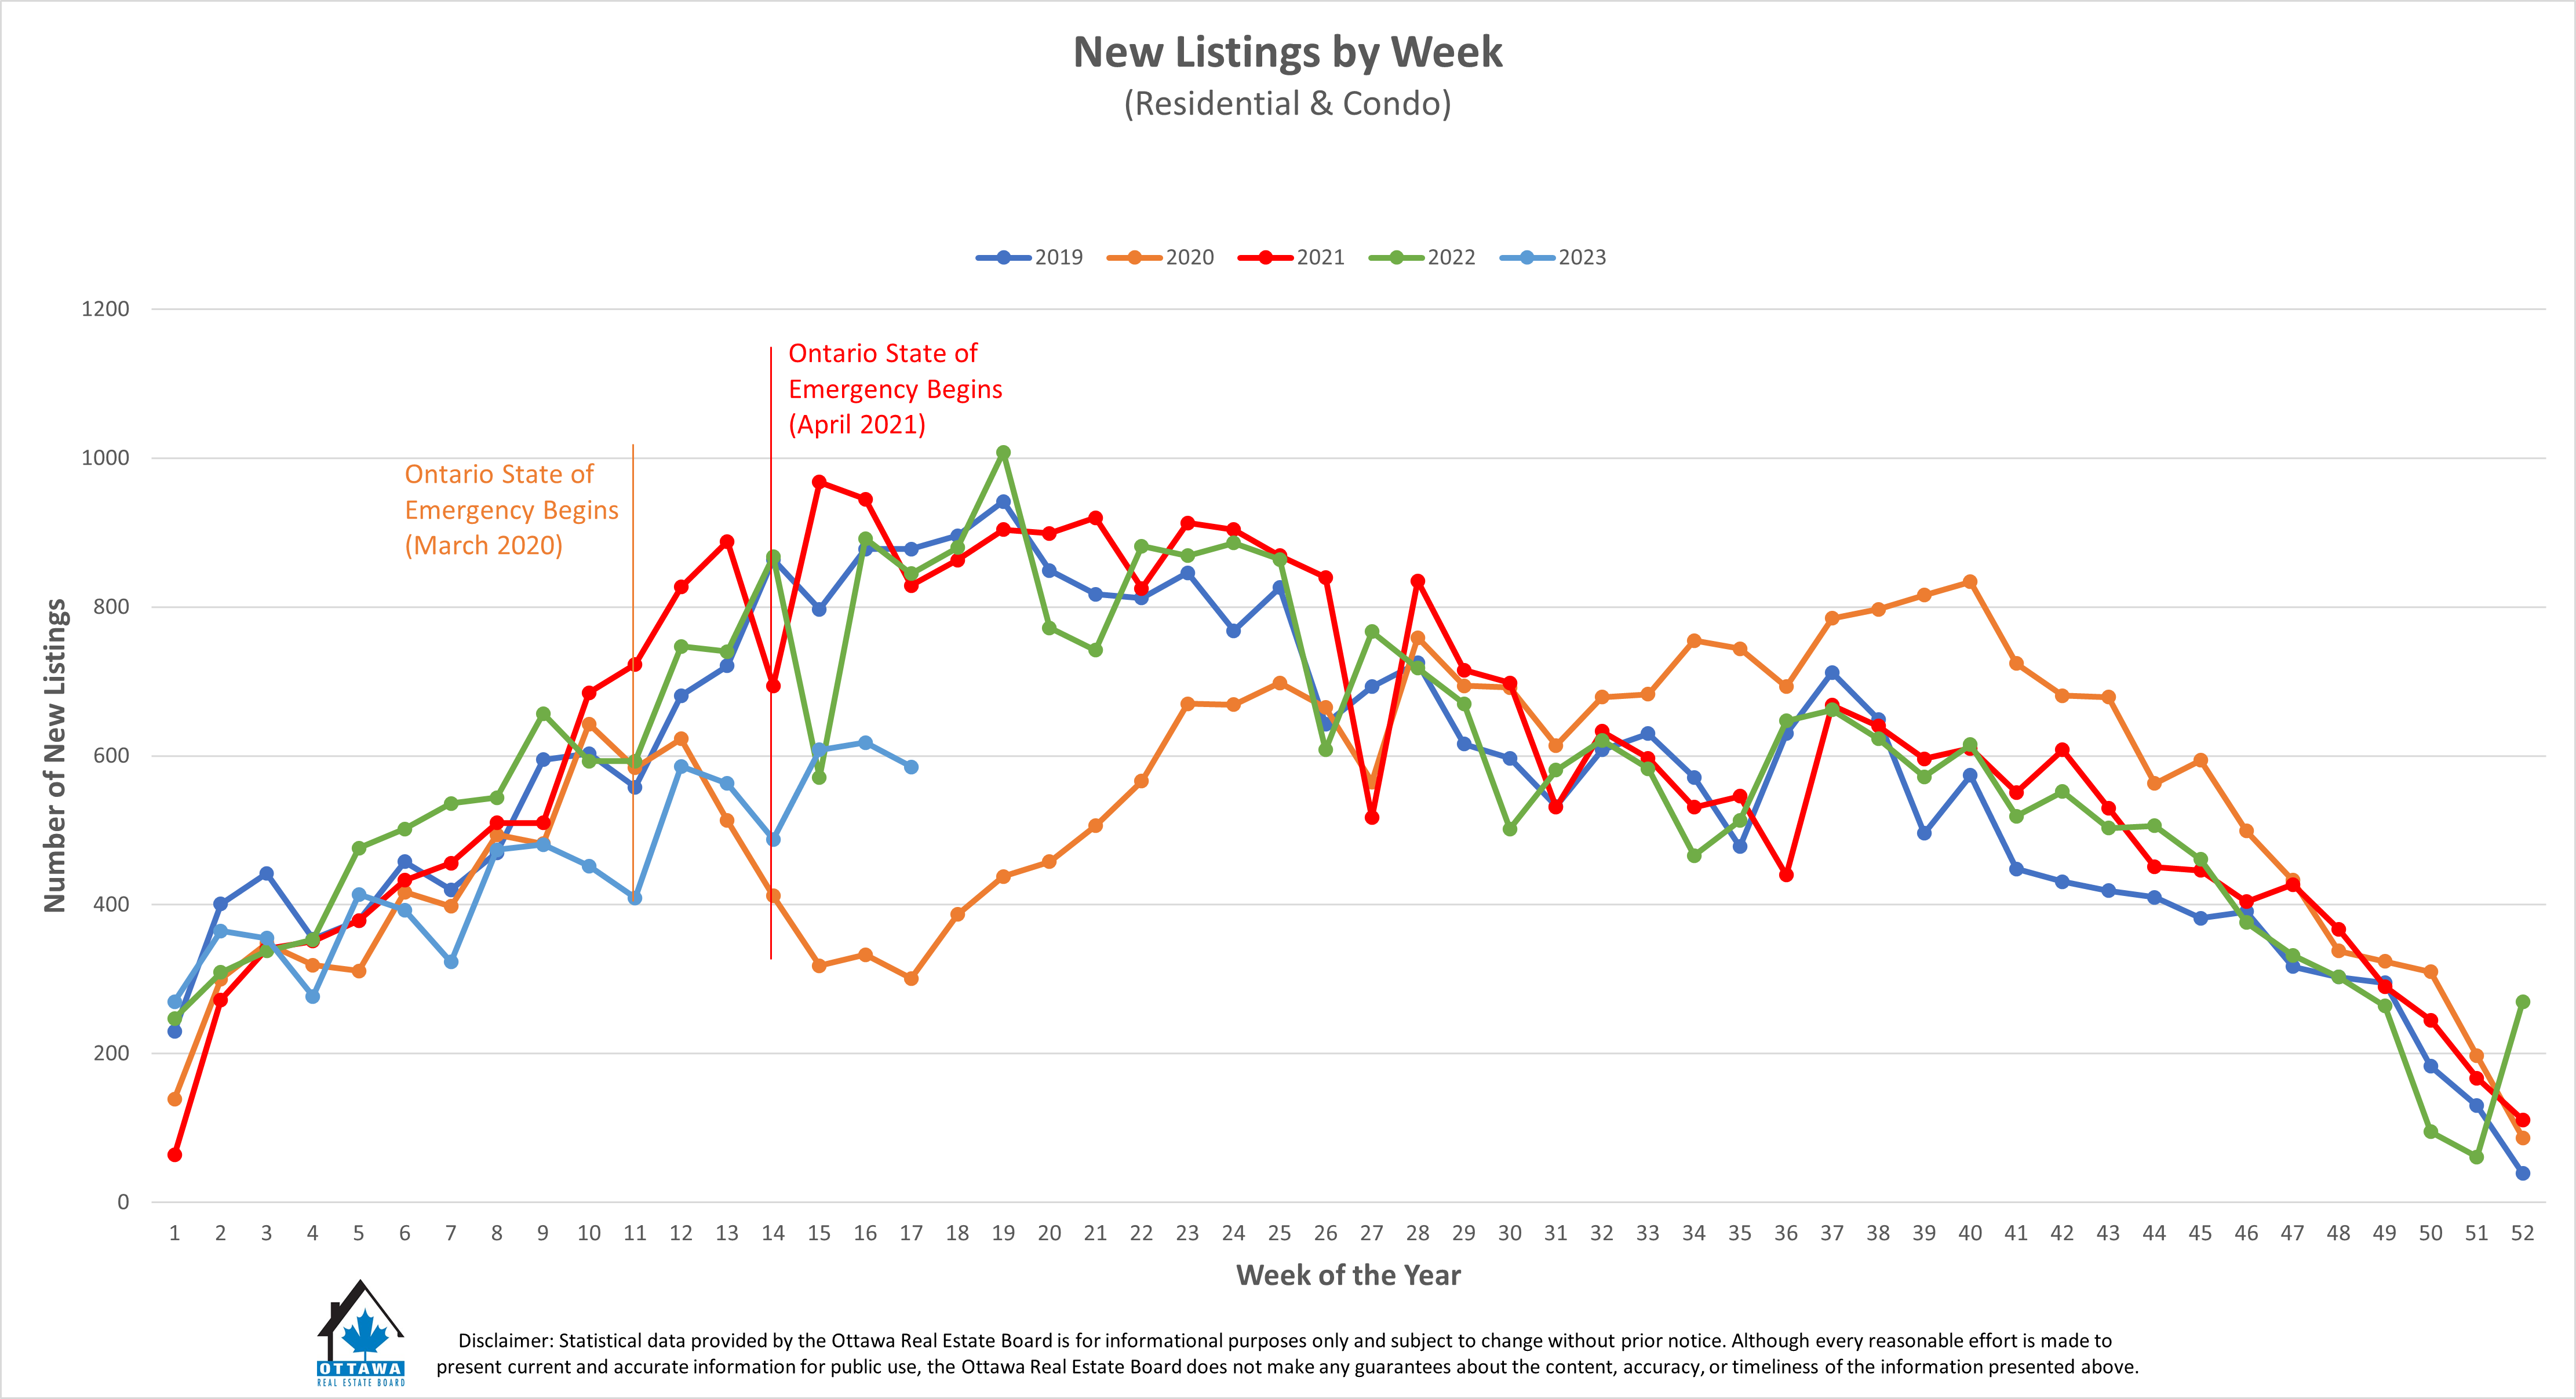
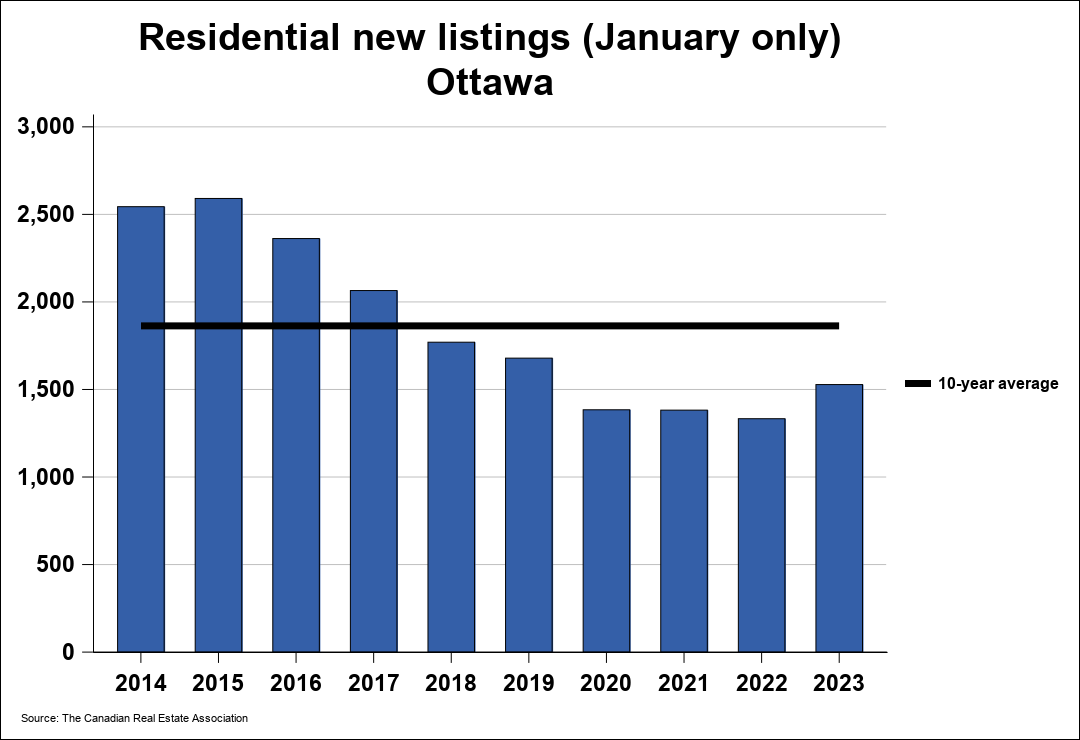
LOW INVENTORY – NOT ENOUGH NEW LISTINGS: New listings not keeping pace, the available housing stock is declining, and with less than two months of inventory — “we’re back into seller’s market territory,” says Ottawa Real Estate Board President Ken Dekker.
By the Numbers – Average Prices*:
“Upward pressure on sales prices continues with average prices increasing for the fourth month since the market low in December.
MULTIPLE OFFERS: Additionally, multiple offer situations have returned to certain neighbourhoods and overall days on market are maintaining their downward trend. There continues to be low inventory in certain property classes and new product is coming to the market at a slower rate, which is affecting supply.”
By the Numbers – Inventory & New Listings:
“These numbers are static, snapshots in time. REALTORS® can give buyers and sellers a fulsome day-to-day picture of how the market is shifting and heating up this season. They have their fingers on the pulse of each neighbourhood in the city and can help buyers and sellers make localized, strategic, data-informed decisions.”
REALTORS® also help with finding rentals and vetting potential tenants. Since the beginning of the year, OREB Members have assisted clients with renting 2,151 properties compared to 1,786 last year at this time, an increase of 20%.
* OREB cautions that the average sale price can be useful in establishing trends over time but should not be used as an indicator that specific properties have increased or decreased in value. The calculation of the average sale price is based on the total dollar volume of all properties sold. Price will vary from neighbourhood to neighbourhood.
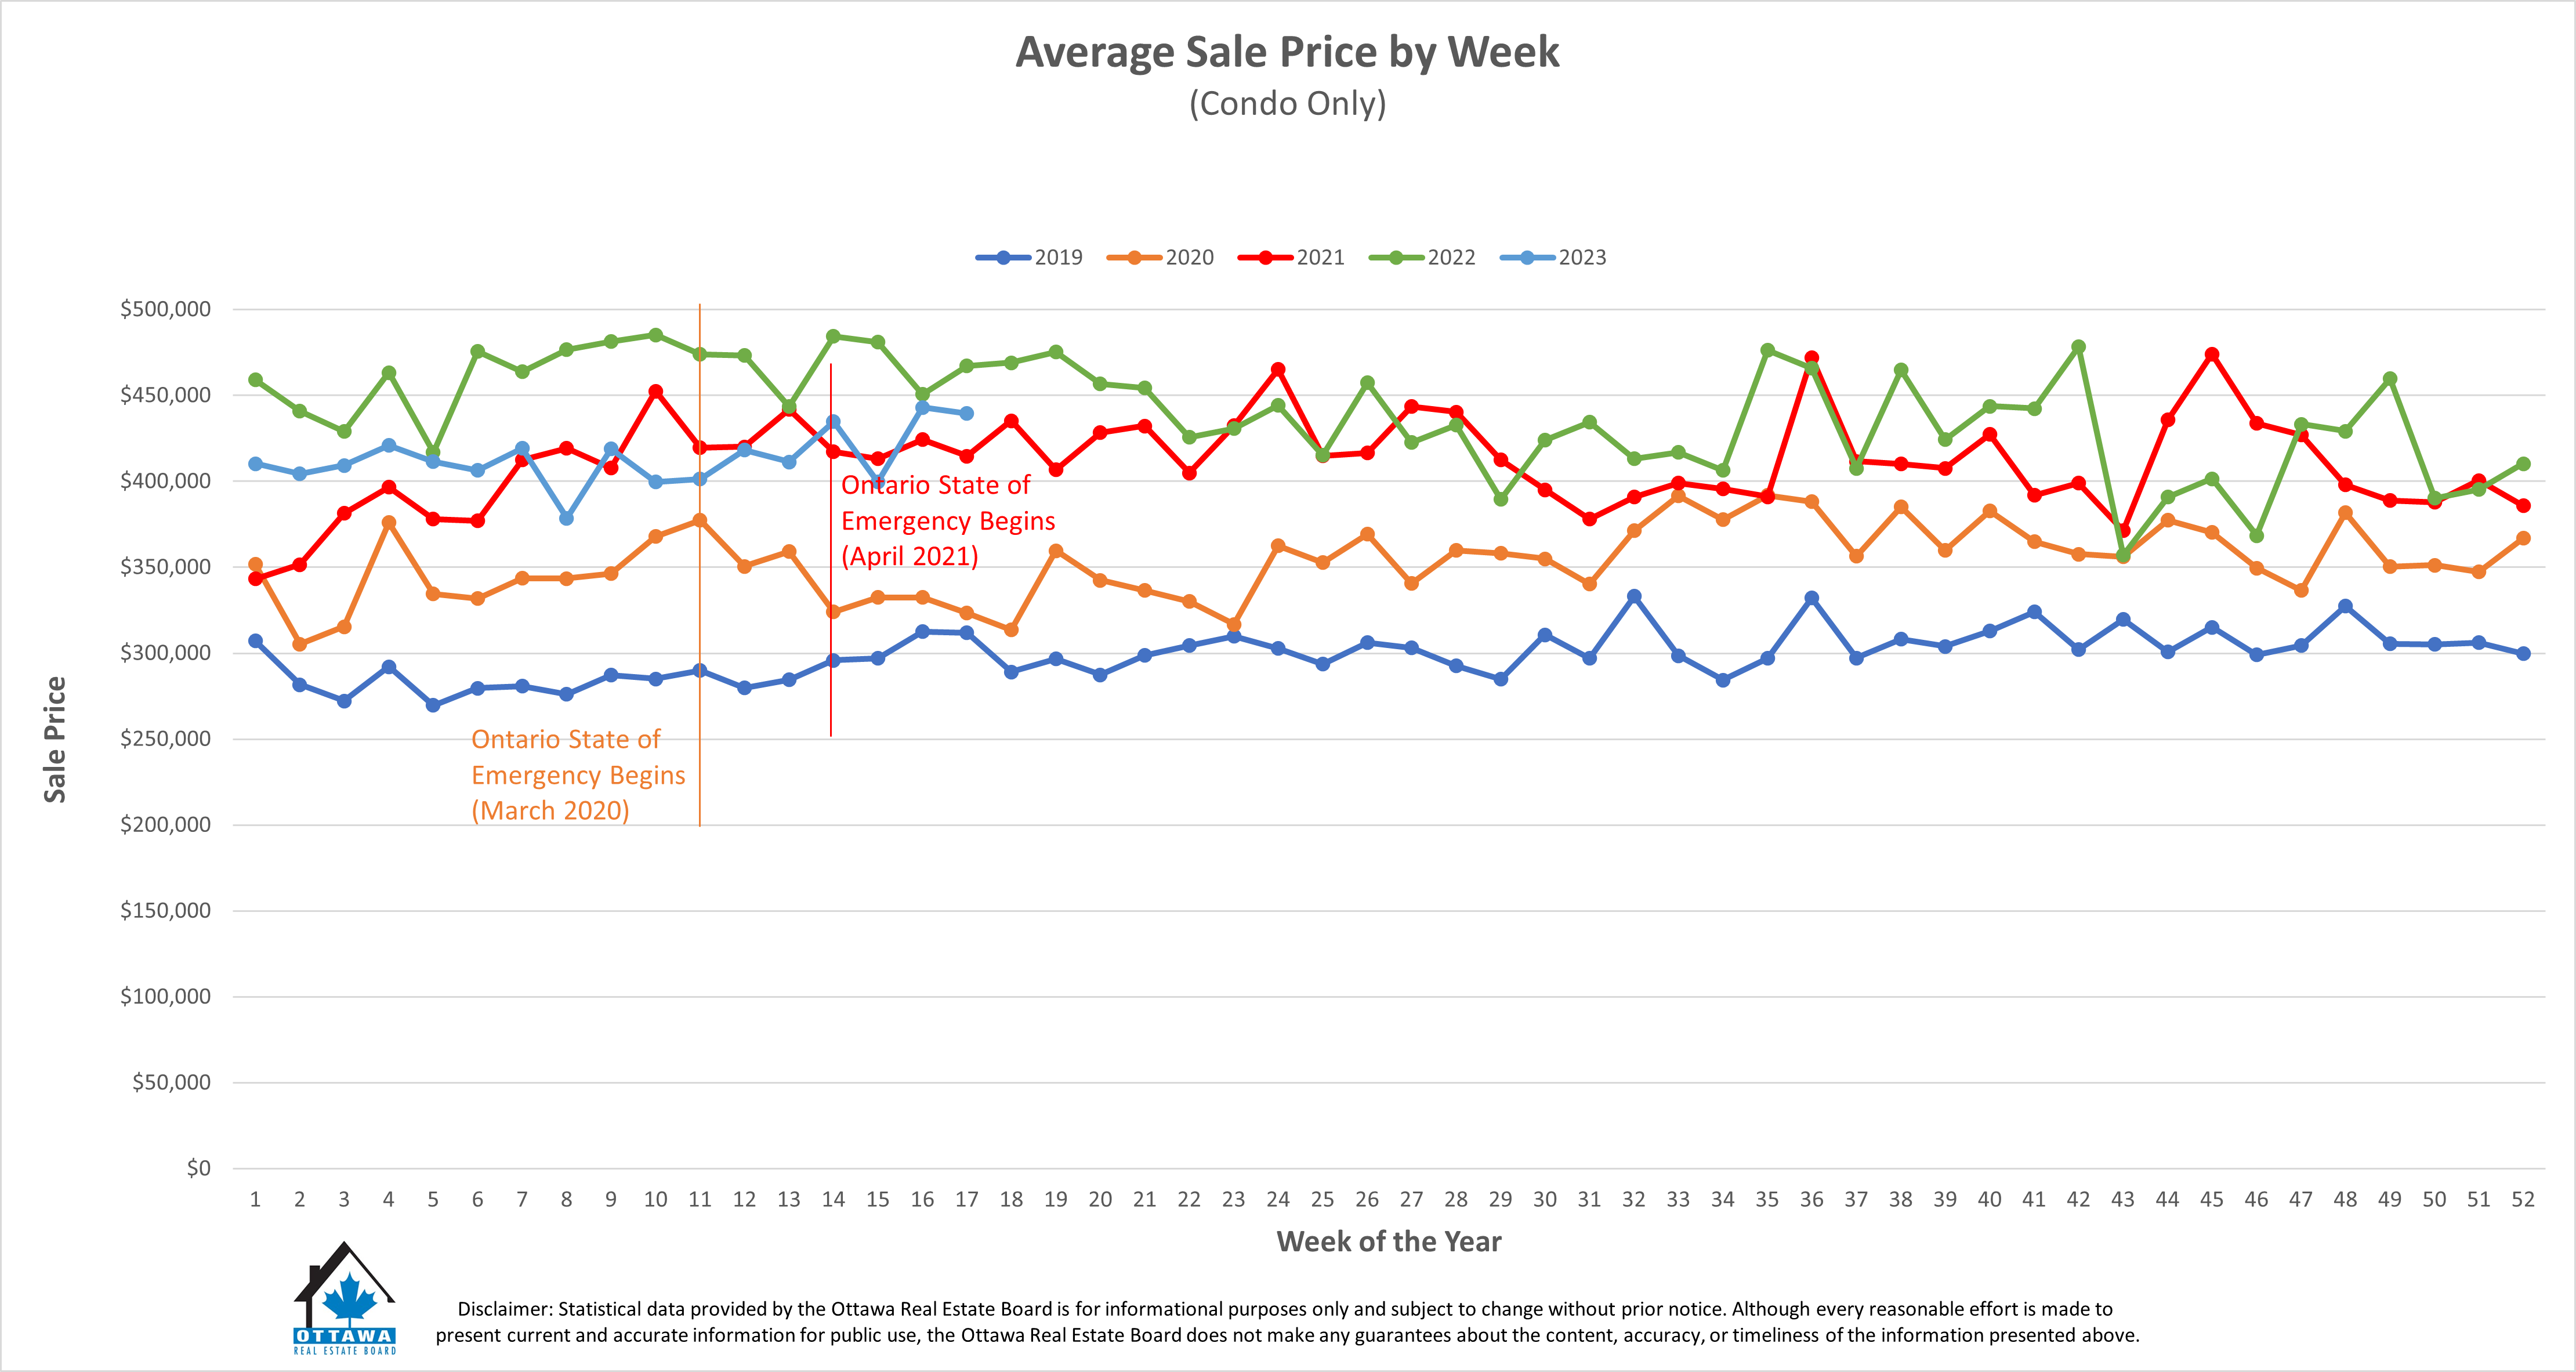
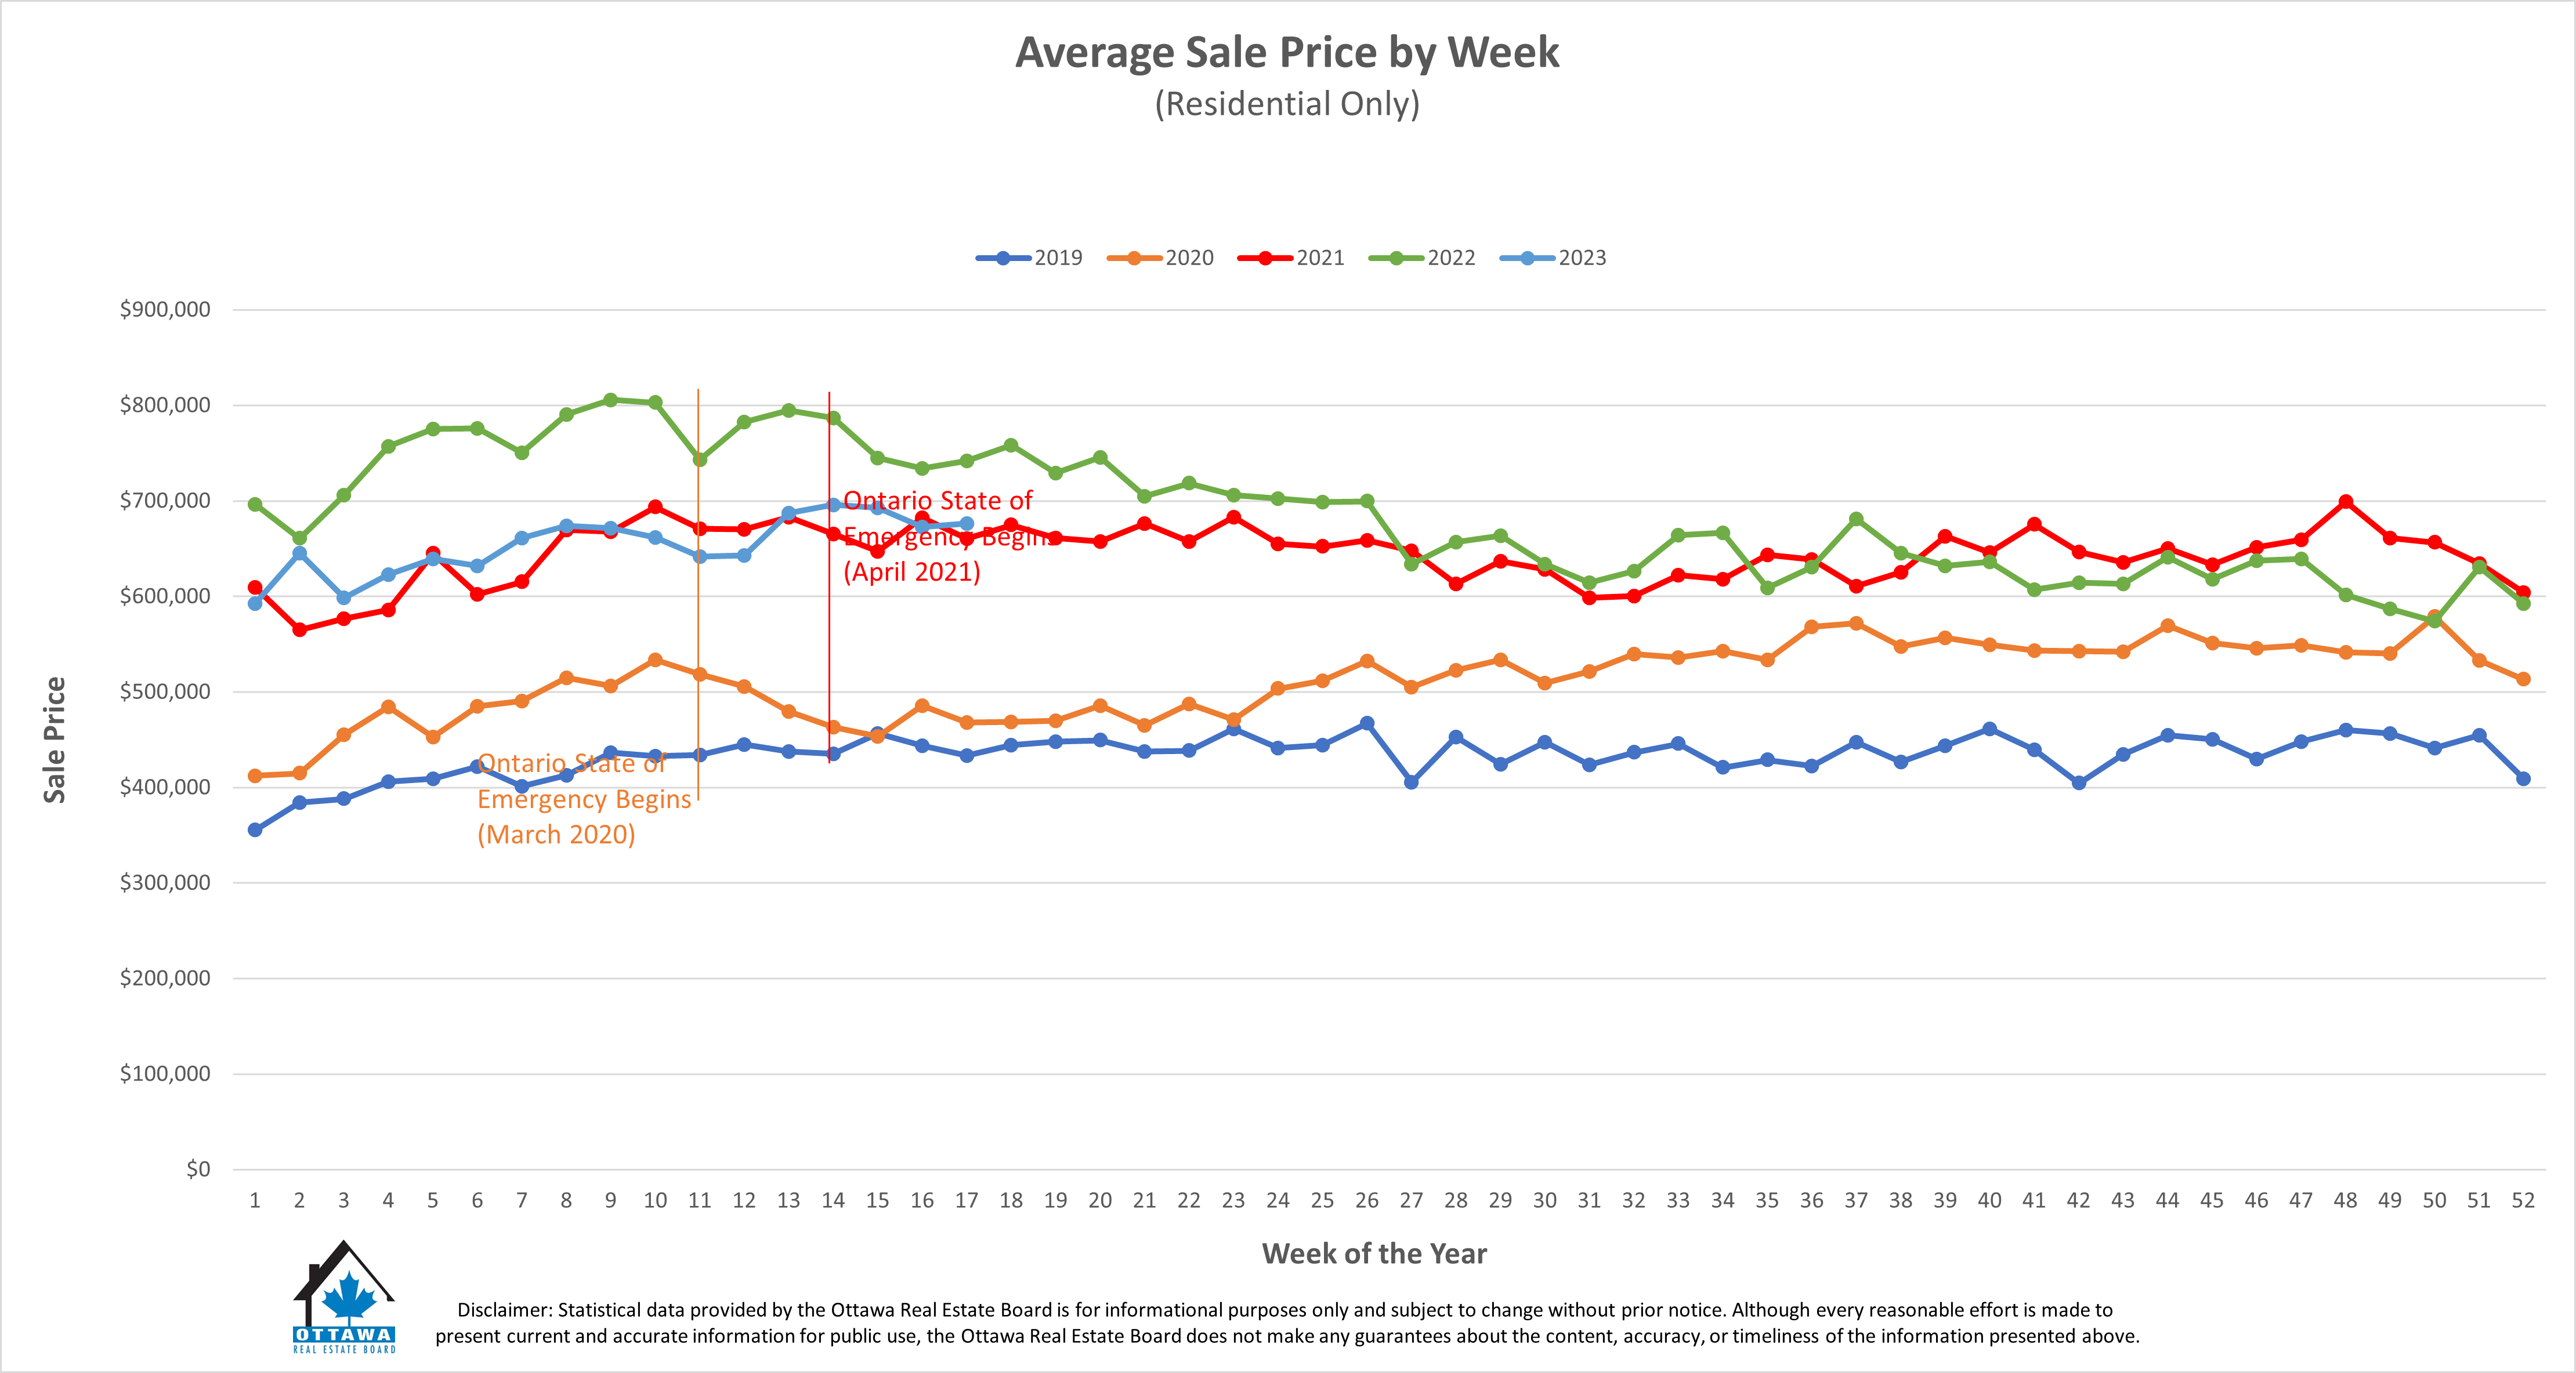
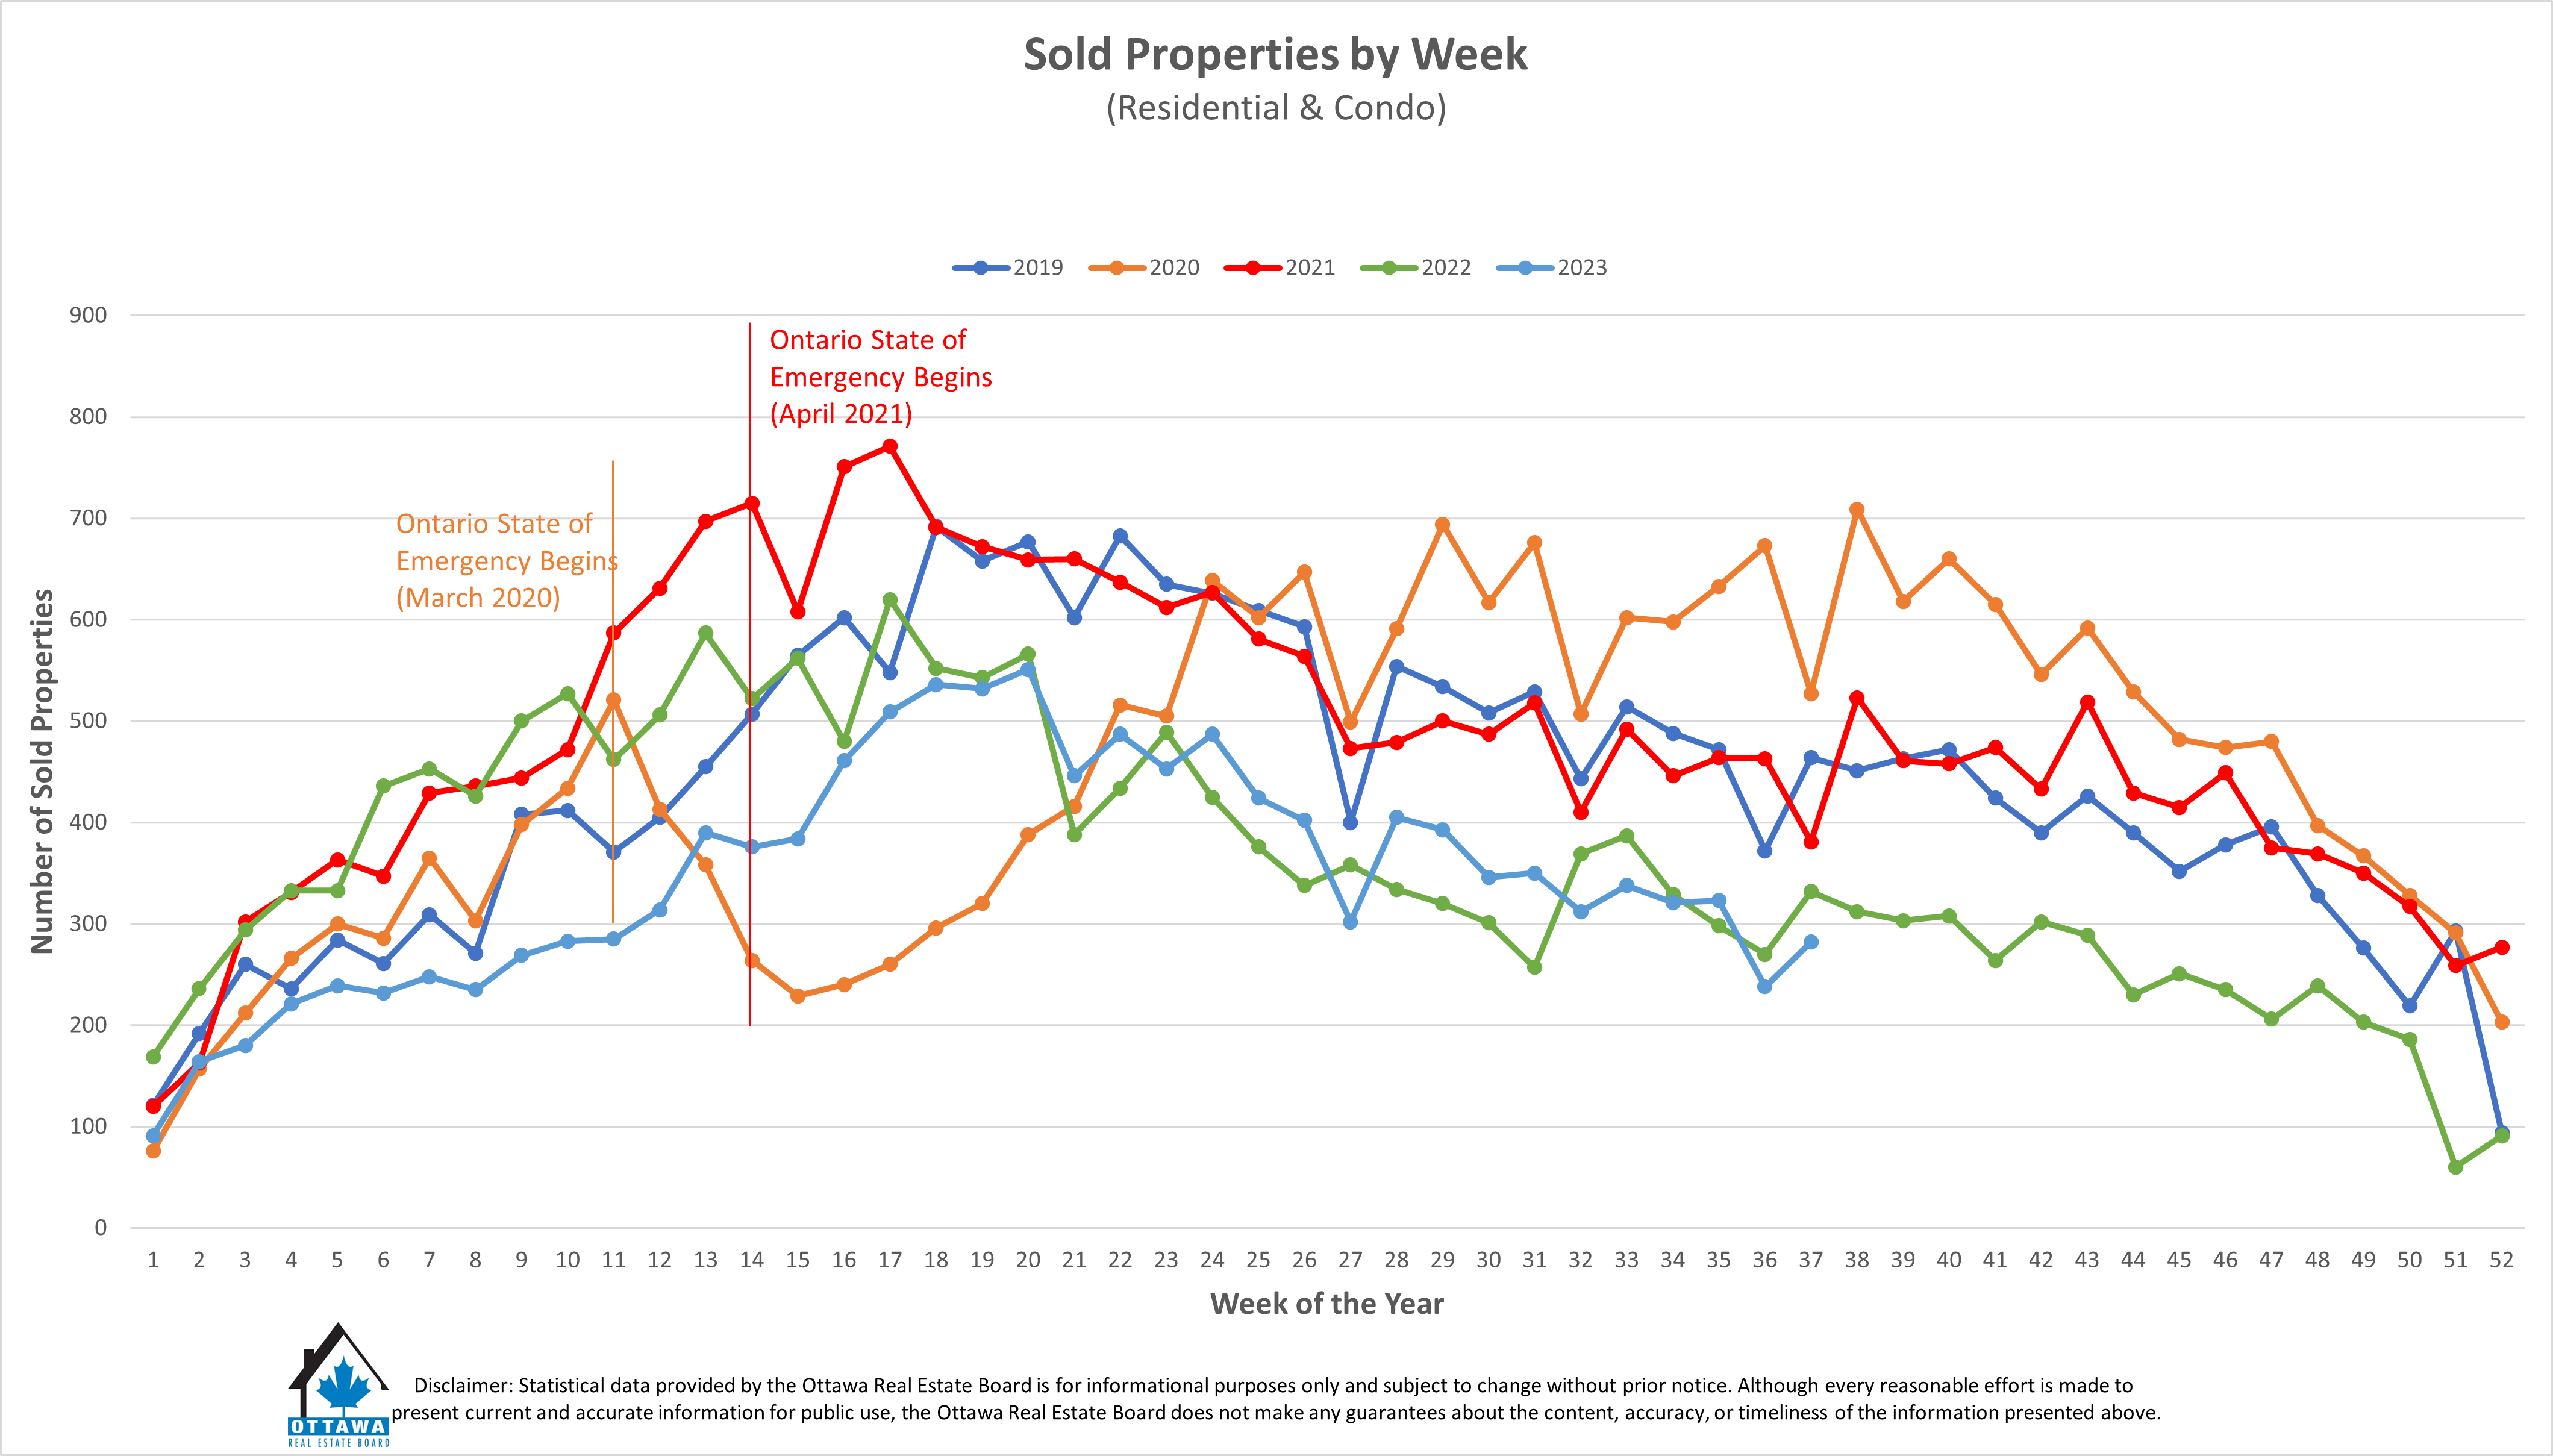
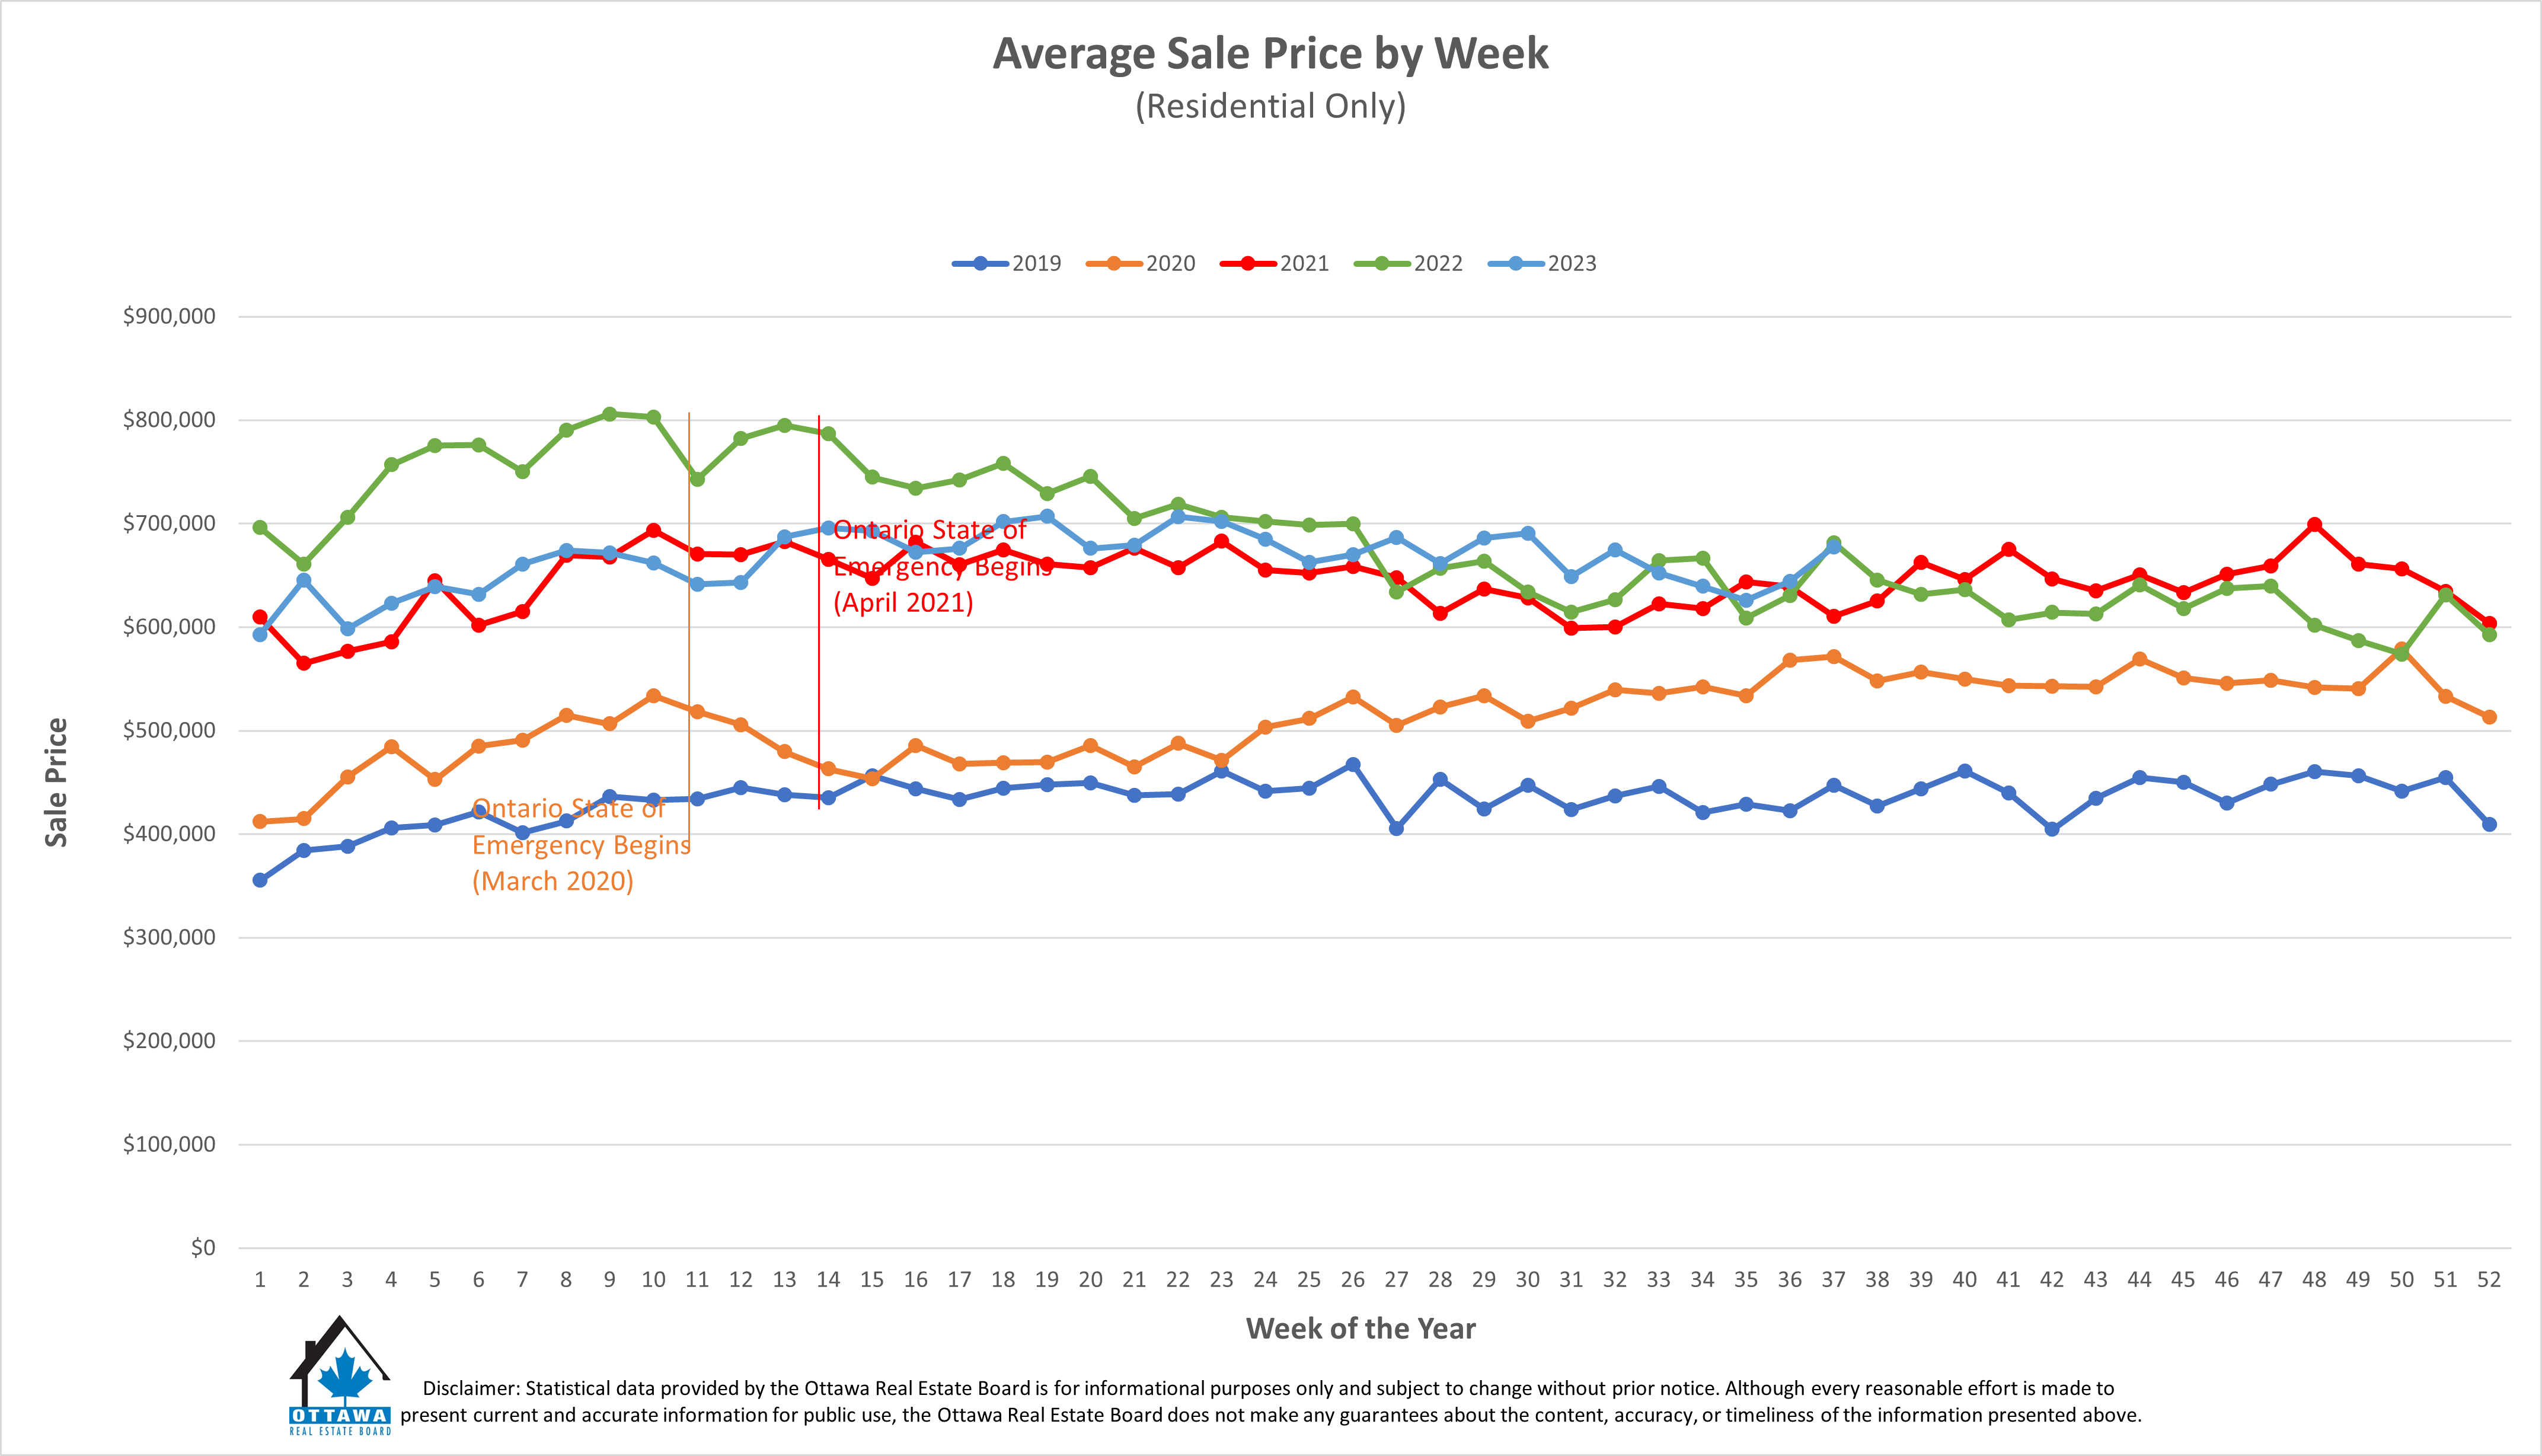
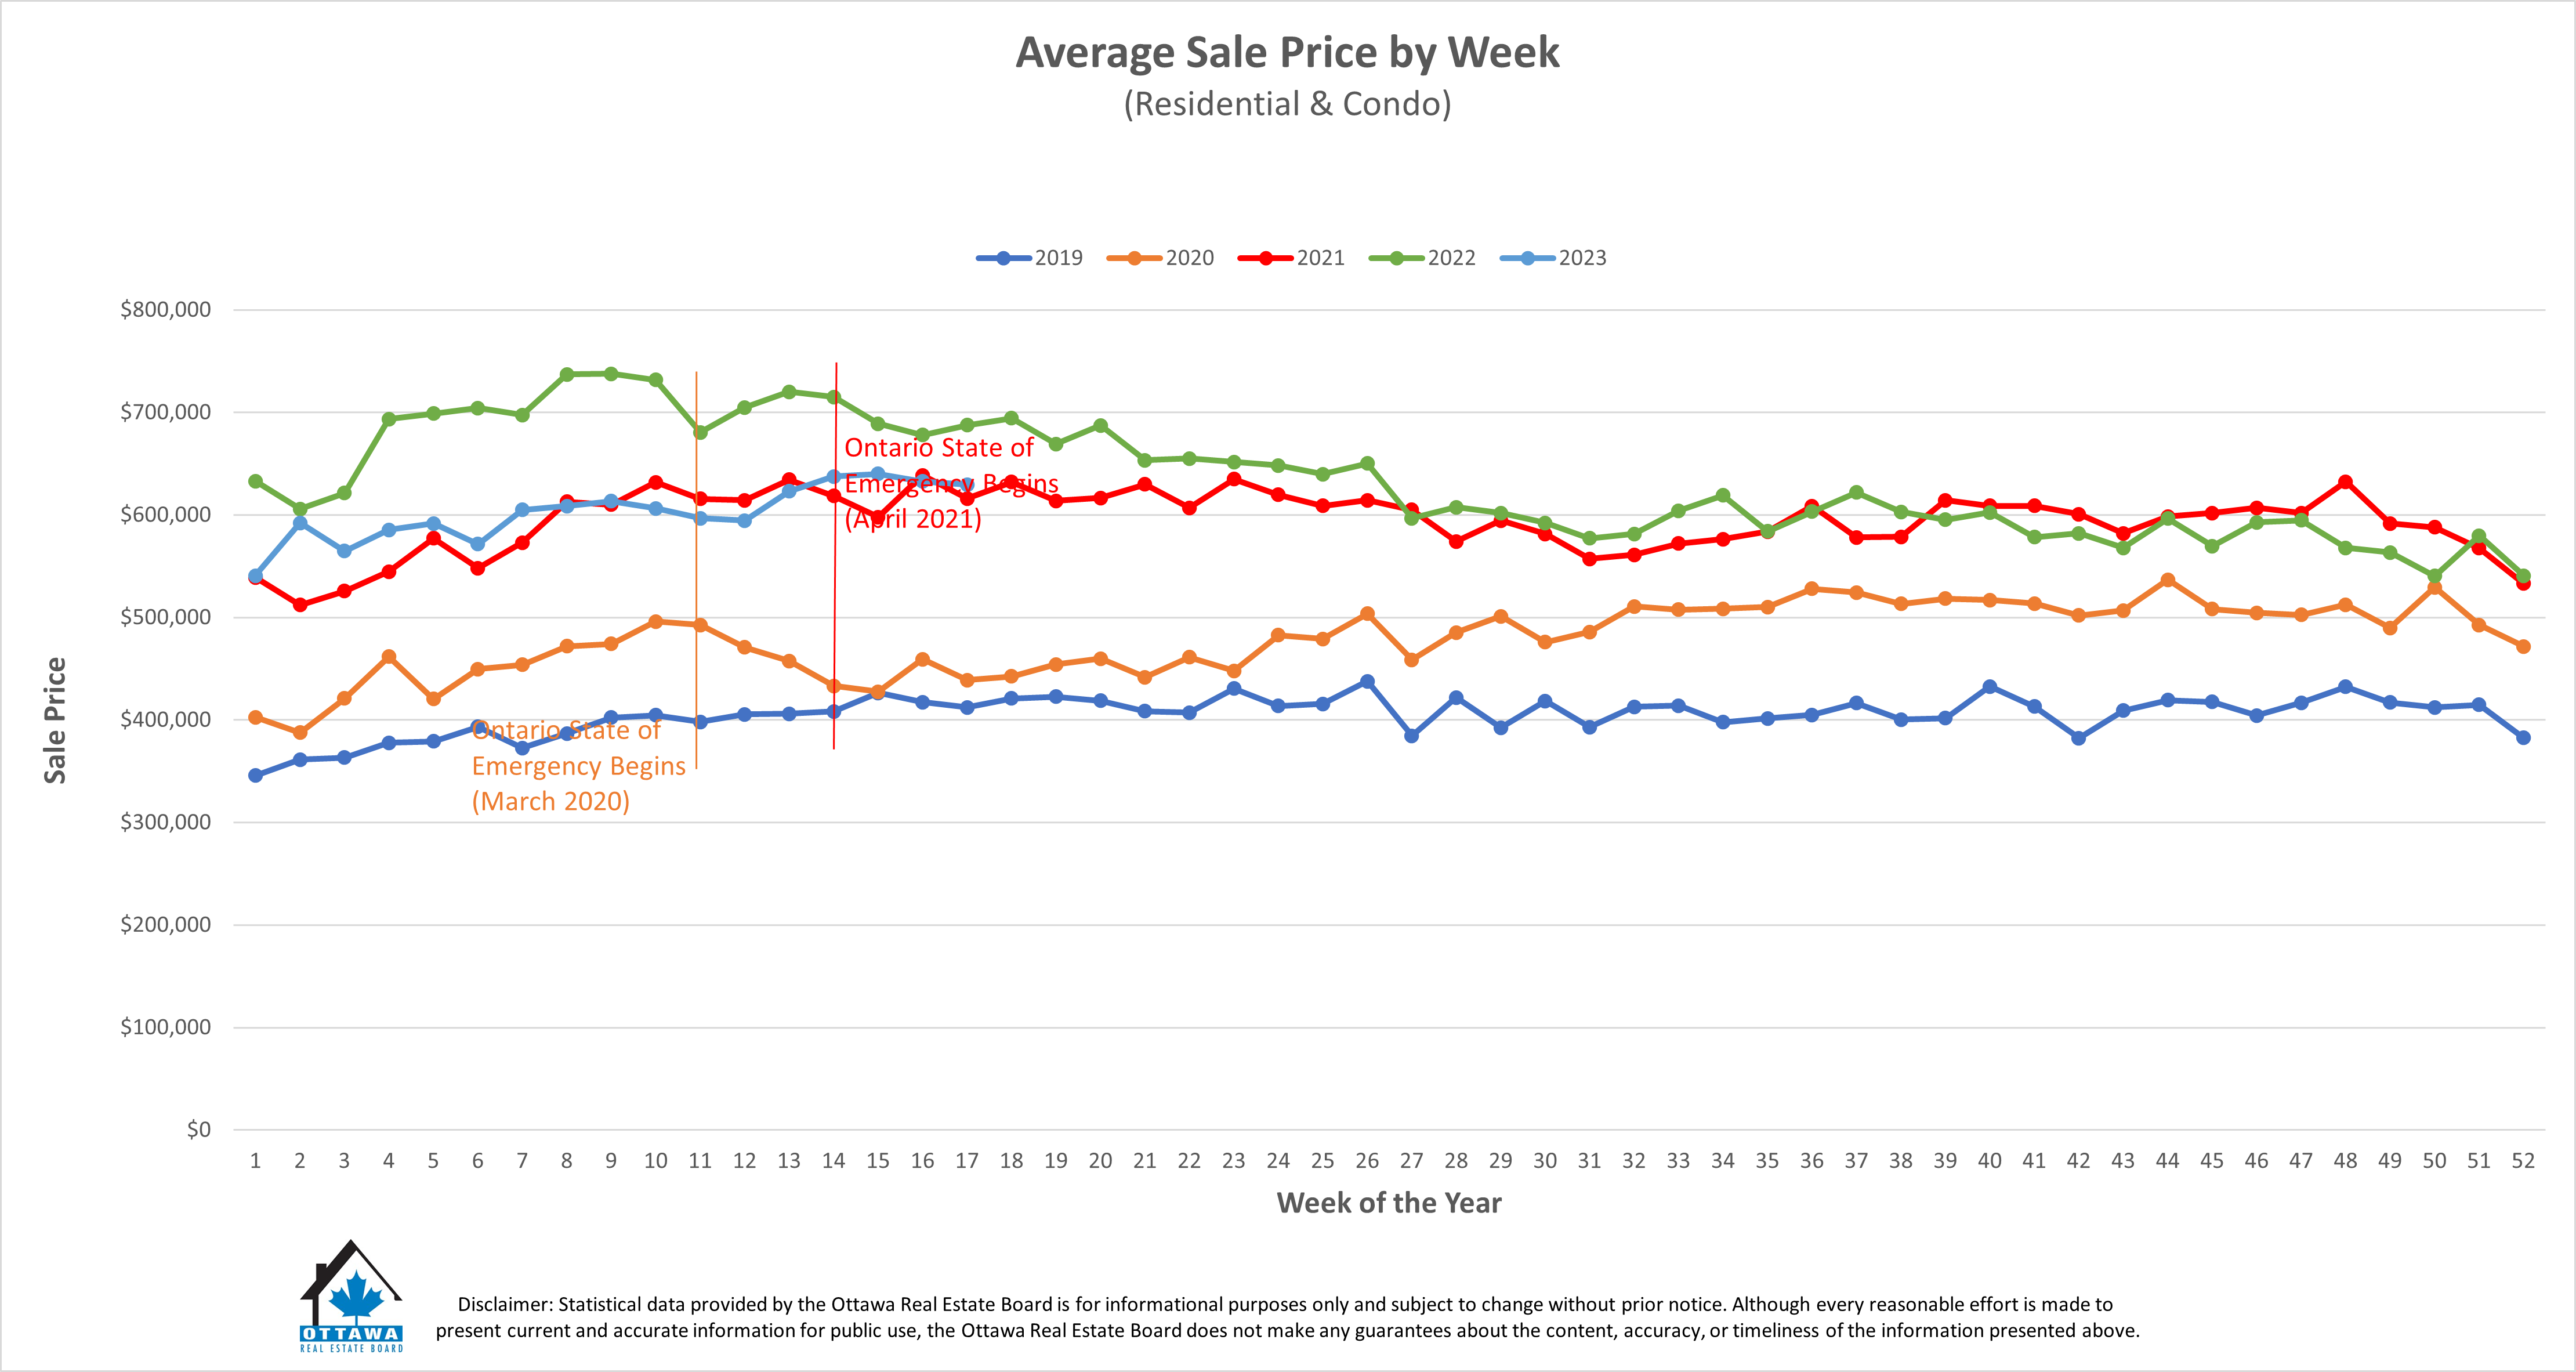
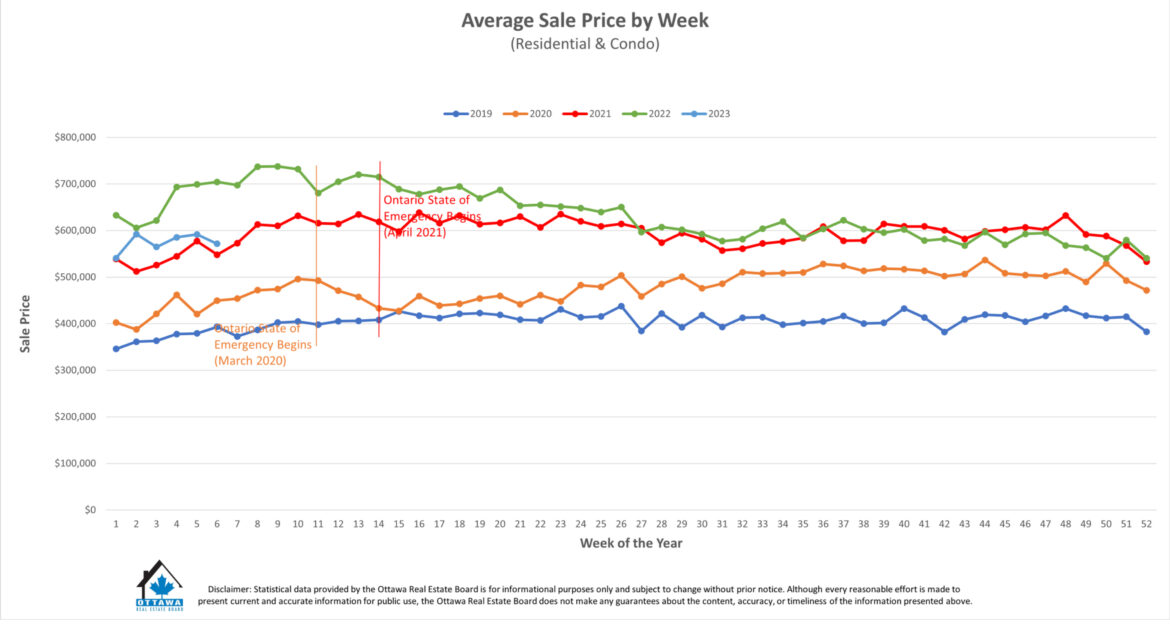
When inventory is low, prices go up. Look at the light blue line, slowly moving upwards, as we get more listings on the MLS market, but not as 2022 volume.
660 listed properties this week, compared to 2022 of 800-1000 listings range.
Low supply means only one thing…prices go up!
Look at the light blue line, slowly moving upwards in Sale Prices.
OREB NEWS
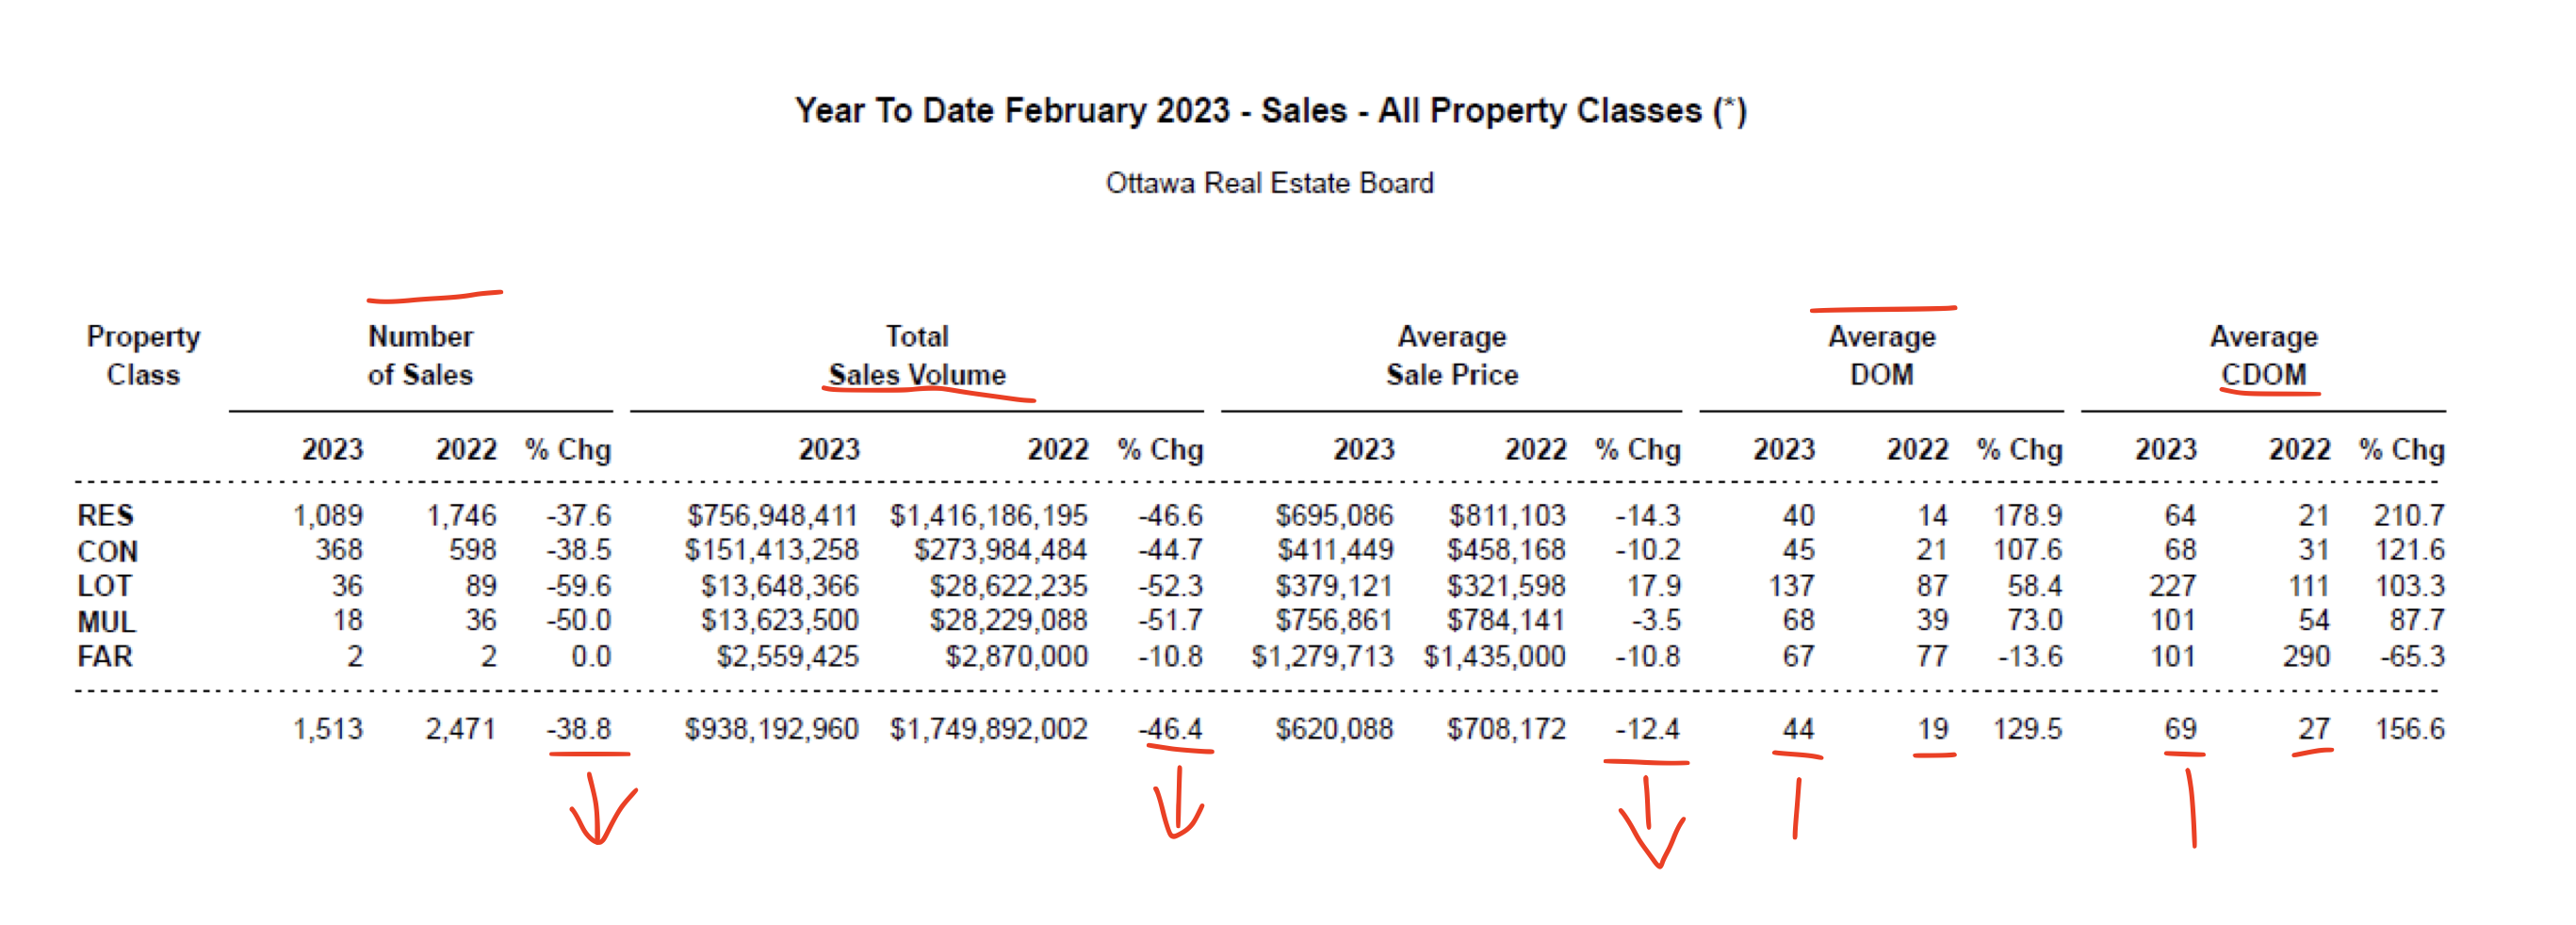
March 3, 2023
Members of the Ottawa Real Estate Board (OREB) sold 855 residential properties in February through the Board’s Multiple Listing Service® (MLS®) System, compared with 1,411 in February 2022, a decrease of 39%. February’s sales included 633 in the freehold-property class, down 42% from a year ago, and 222 in the condominium-property category, a decrease of 31% from February 2022. The five-year average for total unit sales in February is 1,157.
“We’re going to see declines in transactions and prices when we compare current figures to last February — the height of the pandemic resale market activity,” says Ottawa Real Estate Board’s President Ken Dekker. “On the other hand, with the Bank of Canada holding interest rates steady, prospective buyers have more budget certainty to work with as we head into the spring market.”
By the Numbers – Average Prices*:
“The average price increase for freeholds over January could be an indicator that buyers have normalized to the current interest rates. And perhaps, it’s a glimmer of more activity to come in the months ahead.”
By the Numbers – Inventory & New Listings:
“A decrease in the days on market, paired with fewer new listings entering the market, is good news for sellers,” says Dekker. “However, if that trend continues to impact our supply stock and we don’t get more inventory, our otherwise balanced market could swing back into seller’s territory — but it’s too early to predict.”
“The best advice for sellers and buyers in today’s market is to pay close attention to the comparison and competition insights only a REALTOR® can offer. Ottawa is made up of many micro-markets, and neighbourhood-level data is vital to standing out and closing deals.”
REALTORS® also help with finding rentals and vetting potential tenants. Since the beginning of the year, OREB Members have assisted clients with renting 995 properties compared to 800 last year at this time, an increase of 24%.
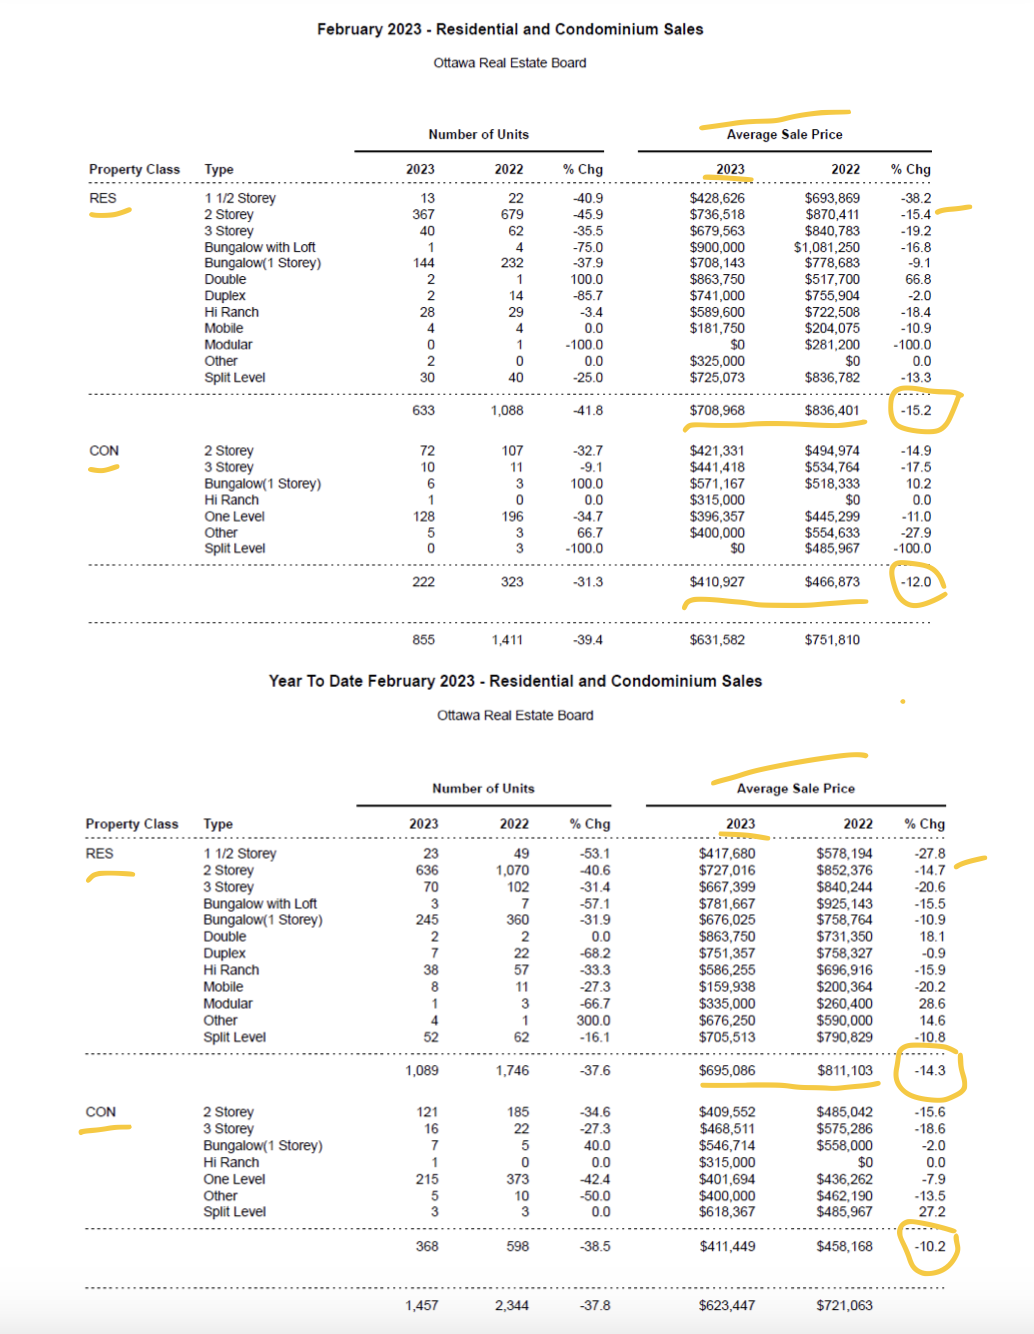
Average Sale Price February 2023= from $708,172 down to $620,088 (-12.4% down)
Quantity of sales: 2471 down to 1513 in Feb 2023 (-38% down)
CDOM= Re-listed : Days on Market from 27 to 69 days ( more days on market: +42 days)
DOM= Days on Market – from 19 days TO 44 days longer in 2023 ( more days on market: +25 days)

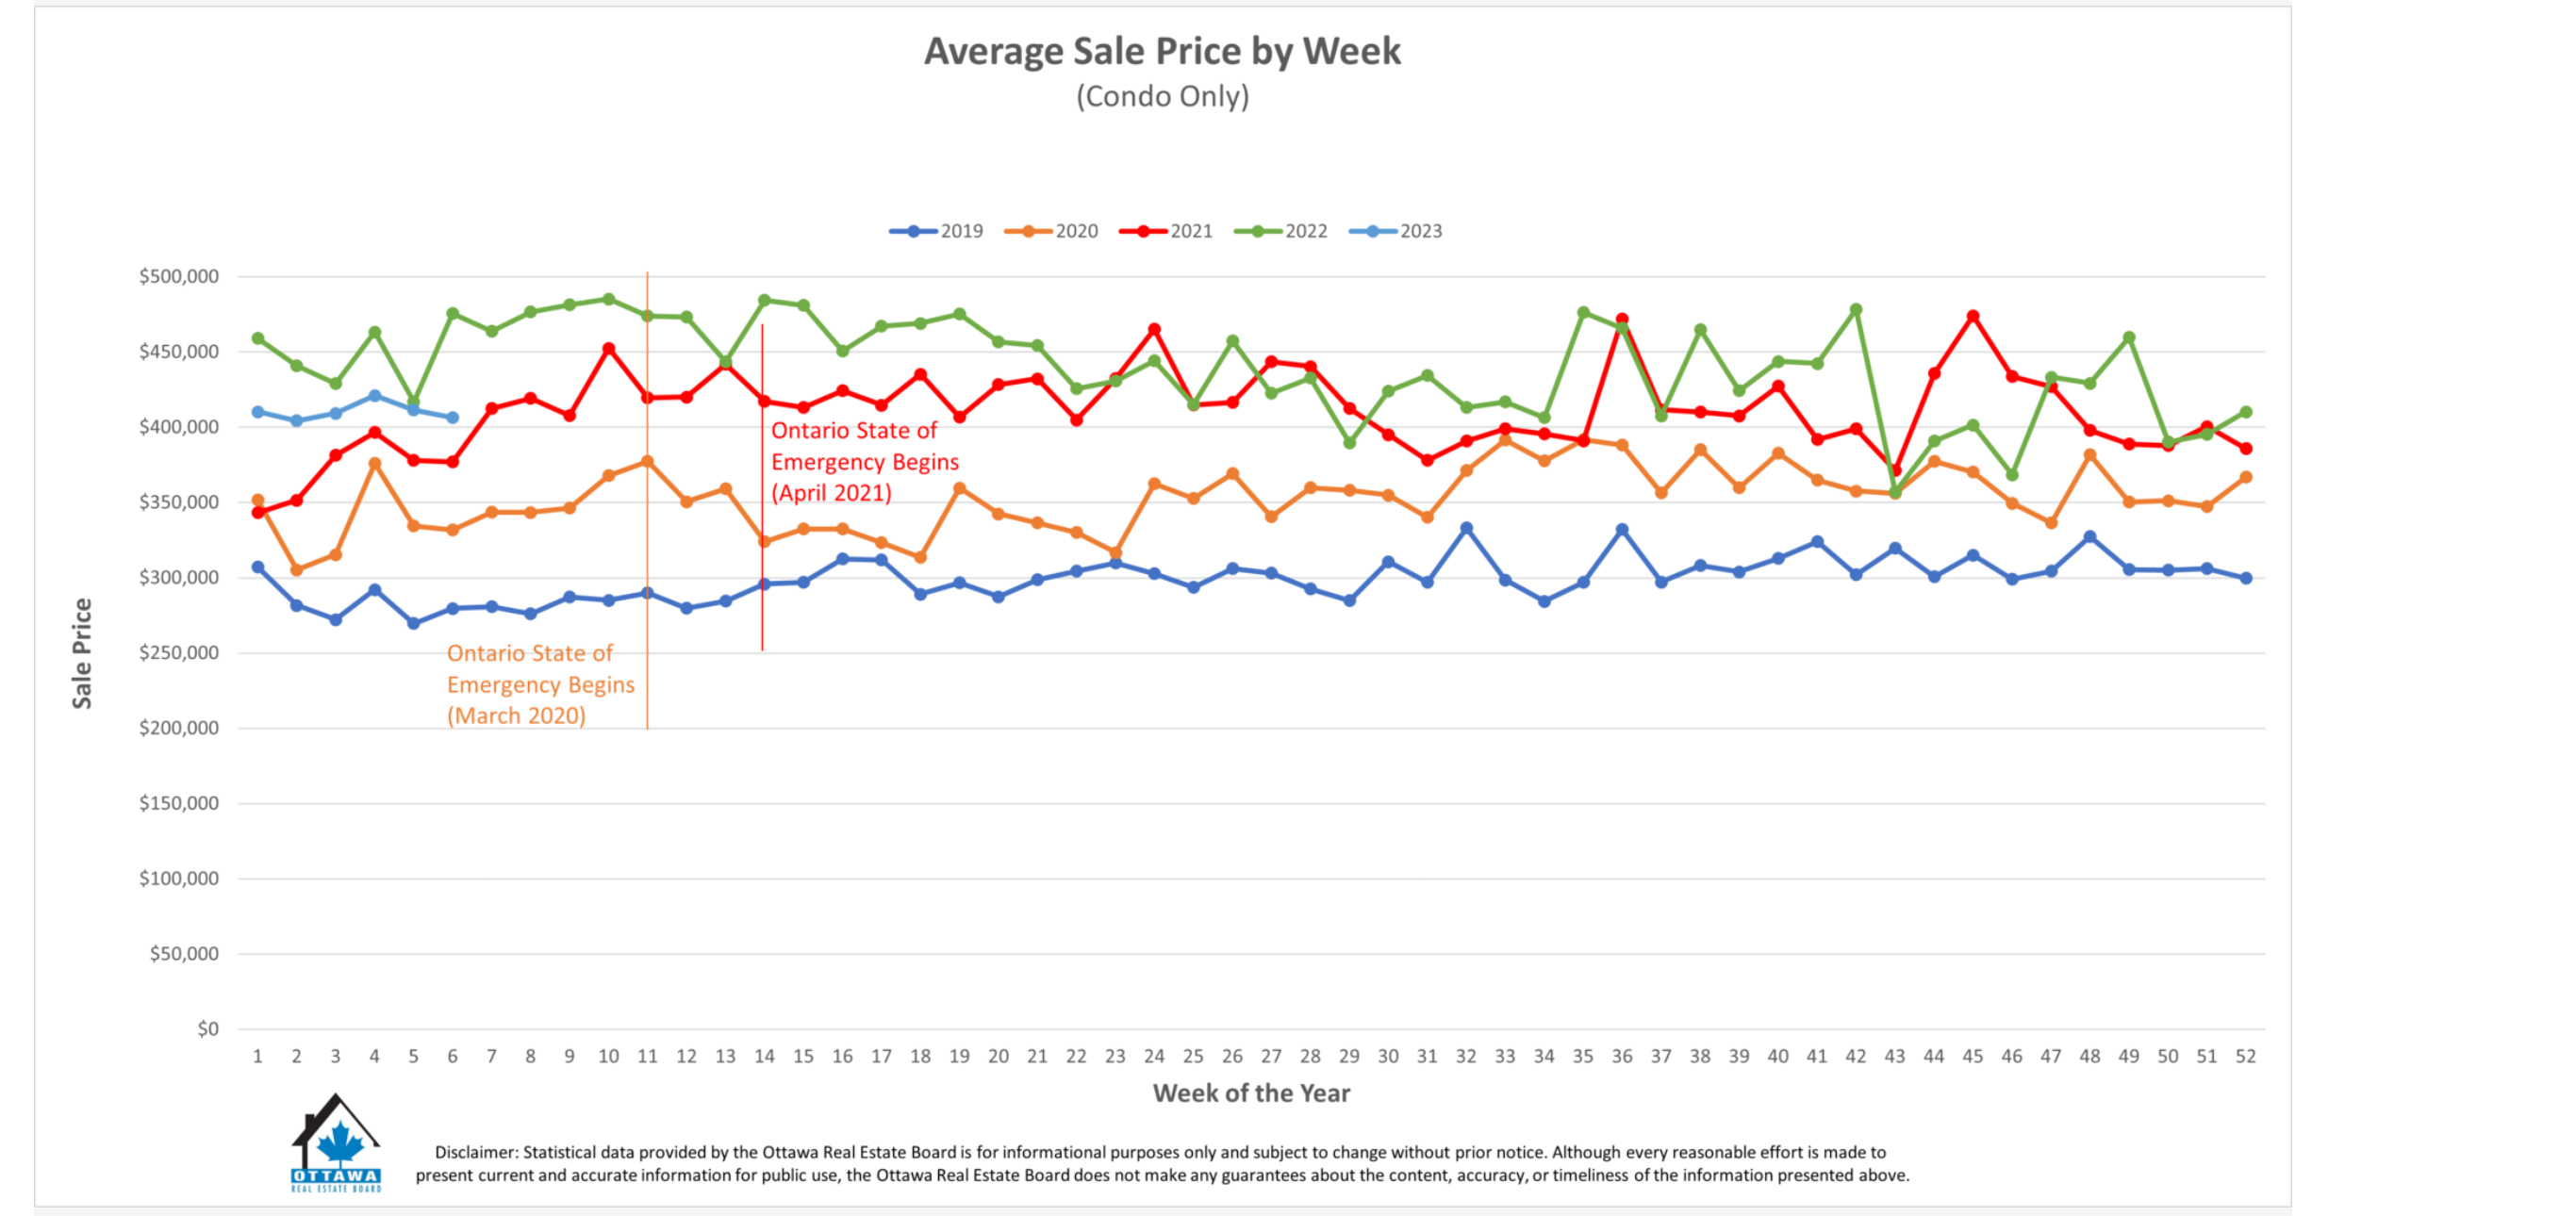
Lets look at this weekly average price in Ottawa real estate.
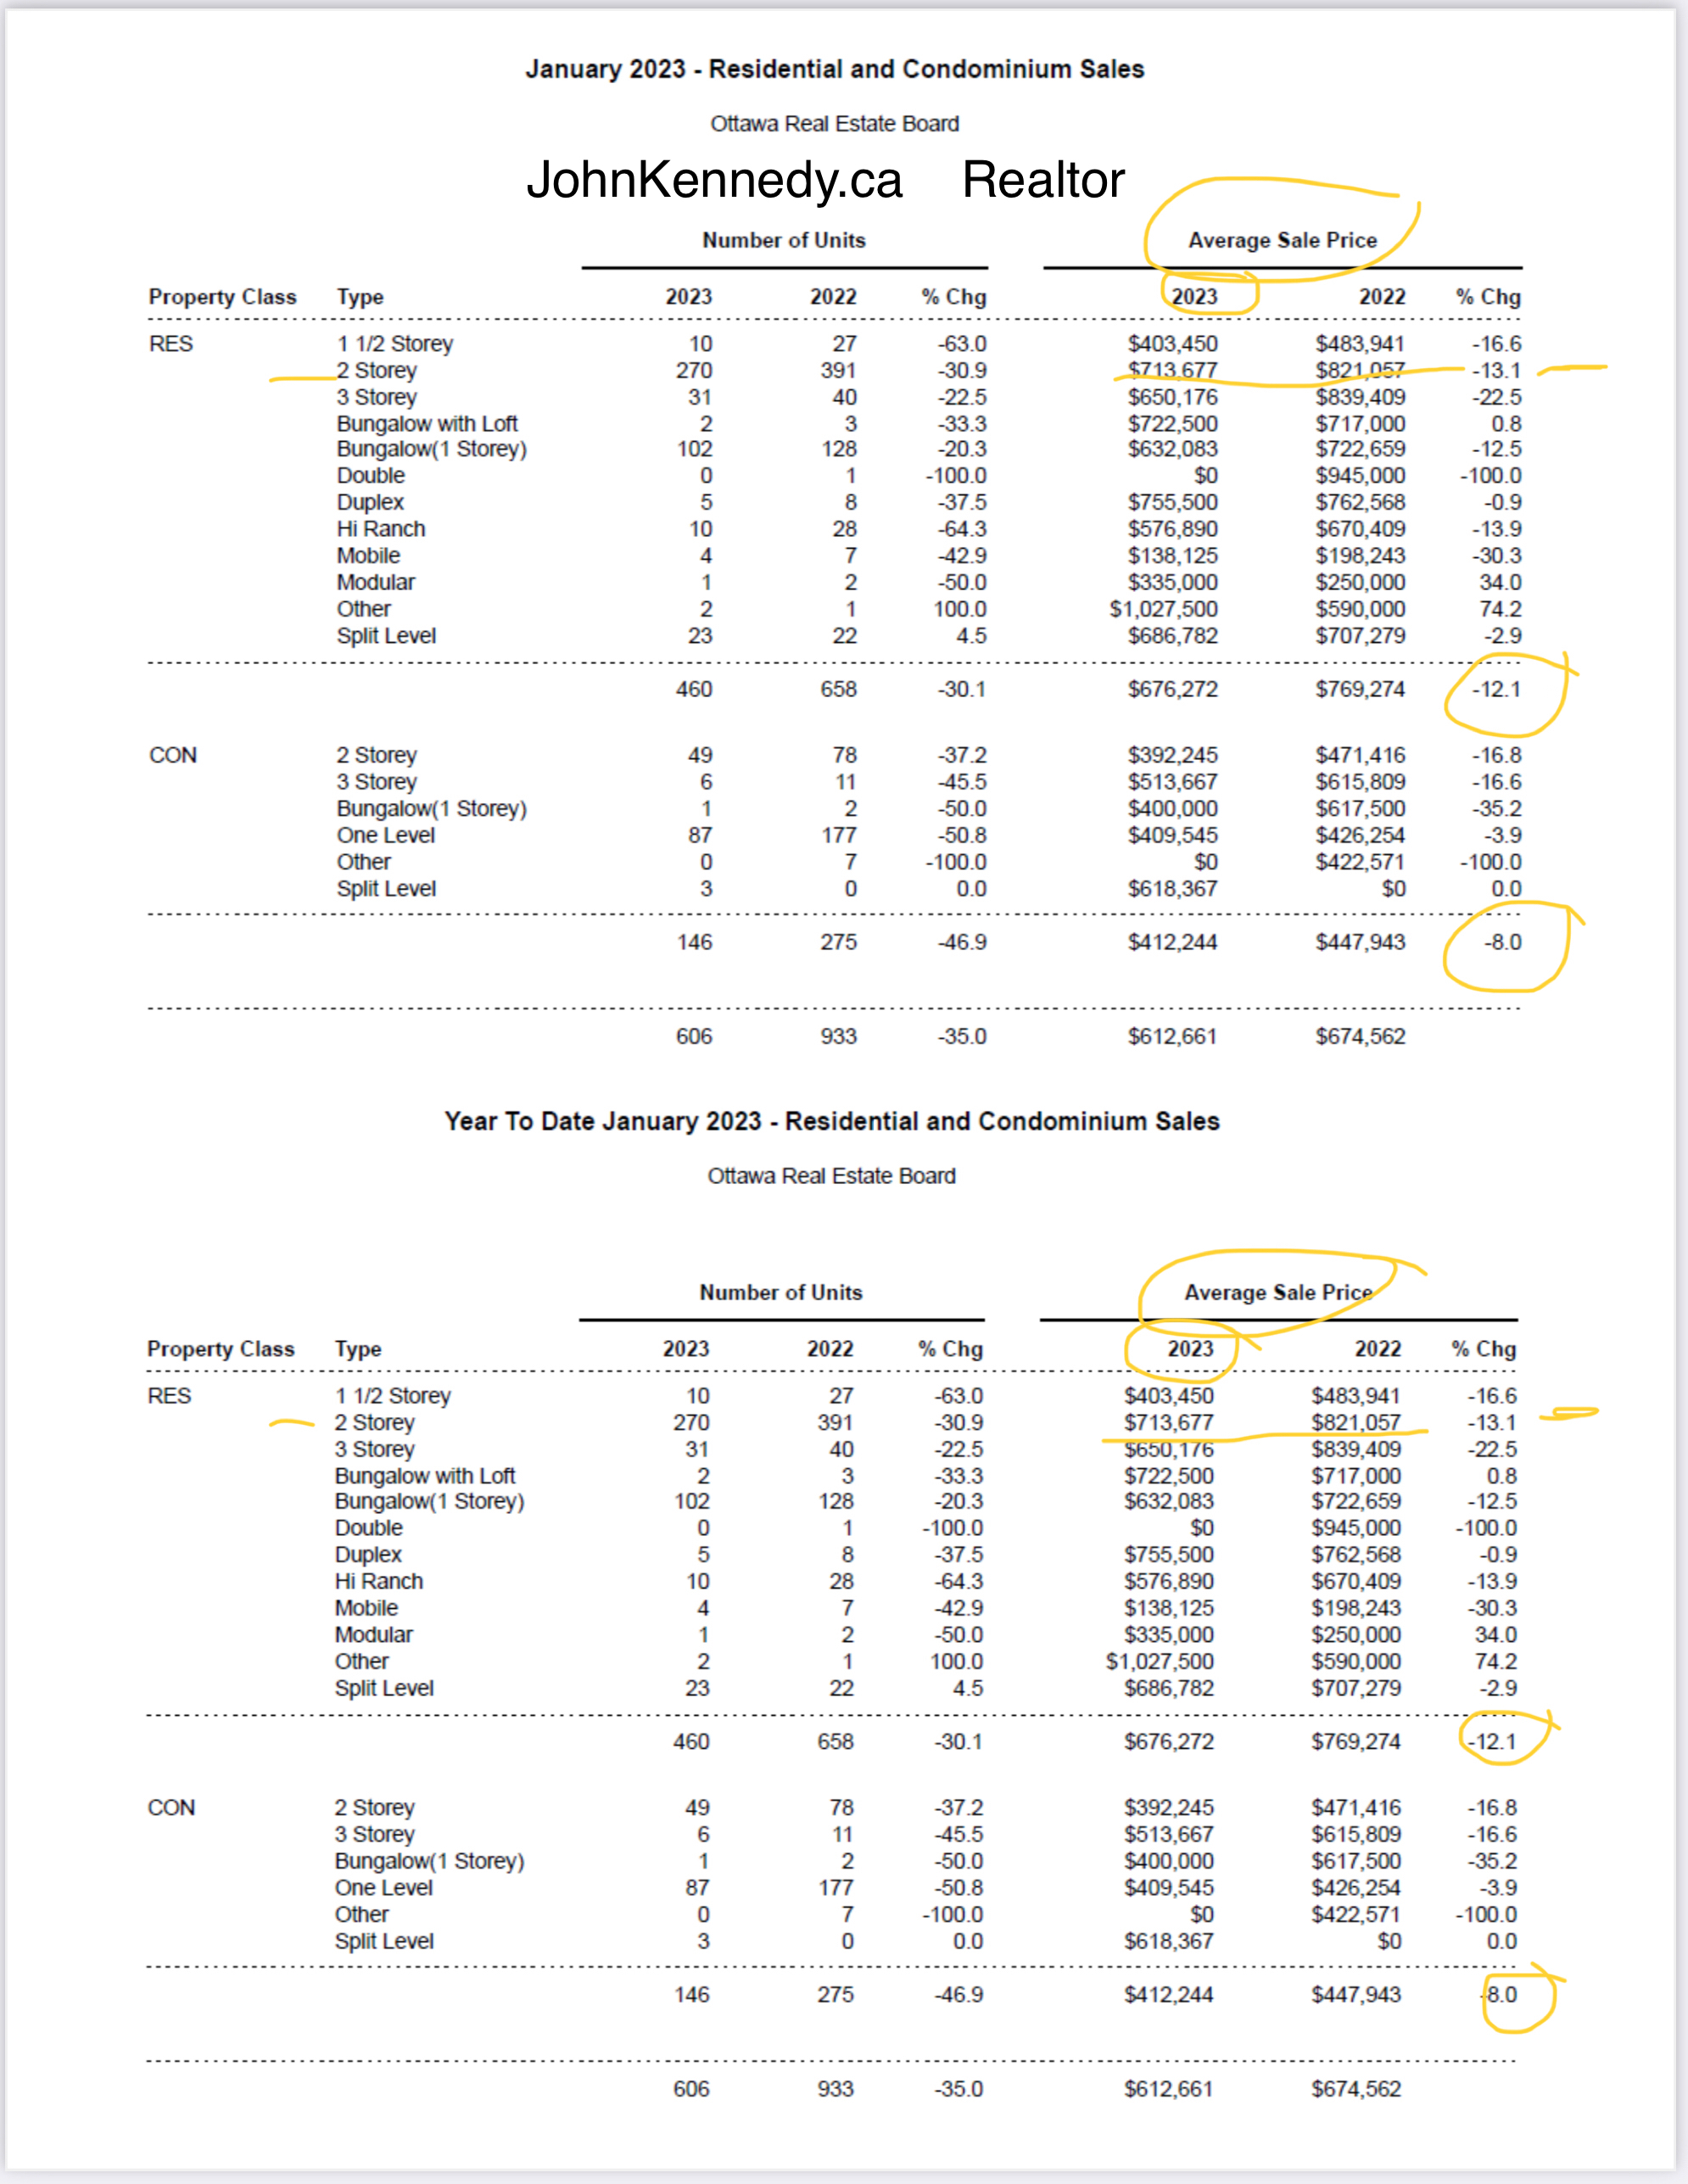
February 2, 2023
Members of the Ottawa Real Estate Board (OREB) sold 606 residential properties in January through the Board’s Multiple Listing Service® (MLS®) System, compared with 933 in January 2022, a decrease of 35%. January’s sales included 460 in the freehold-property class, down 30% from a year ago, and 146 in the condominium-property category, a decrease of 47% from January 2022. The five-year average for total unit sales in January is 819.
“January’s marked slow down in unit sales over 2022 indicates potential home buyers are taking their time,” says OREB President Ken Dekker. “While last month saw the culmination of the succession of interest rate hikes announced by the Bank of Canada, affordability remains a factor. They may be waiting for a shift in listing prices. They’re being cautious in uncertain conditions.”
By the Numbers – Average Prices*:
“Despite the decrease in average prices, the market should not be considered on a downward slide,” says Dekker. “A hyper COVID-19 seller’s market is now leveling out to our current balanced market state.”
“On a positive note, in comparison to December’s figures, January’s average price of freehold properties increased by 3%. The average price of condos did fall by 5% compared to December but condo pricing tends to fluctuate more due to the small data set.”
By the Numbers – Inventory & New Listings:
“Ottawa’s inventory and days on market figures are typical for a balanced market and another sign that buyers are no longer racing to put in an offer,” says Dekker. “The increase in new listings and supply is a boon for home buyers, who now have more selection and the ability to put in conditions at a less frantic pace. REALTORS® are an essential resource in finding the right property for the right buyer. On the other side of the transaction, REALTORS® can help sellers with hyper-local insights about how to sell in their neighbourhood at a time when pricing is key.”

More people are turning to REALTORS® for help renting properties — 509 this month compared to 410 in January 2022, an increase of 24%. “Even with the increase in housing stock, the tighter rental market is another indication that affordability is keeping some potential buyers on the sidelines.”
* OREB cautions that the average sale price can be useful in establishing trends over time but should not be used as an indicator that specific properties have increased or decreased in value. The calculation of the average sale price is based on the total dollar volume of all properties sold. Price will vary from neighbourhood to neighbourhood.
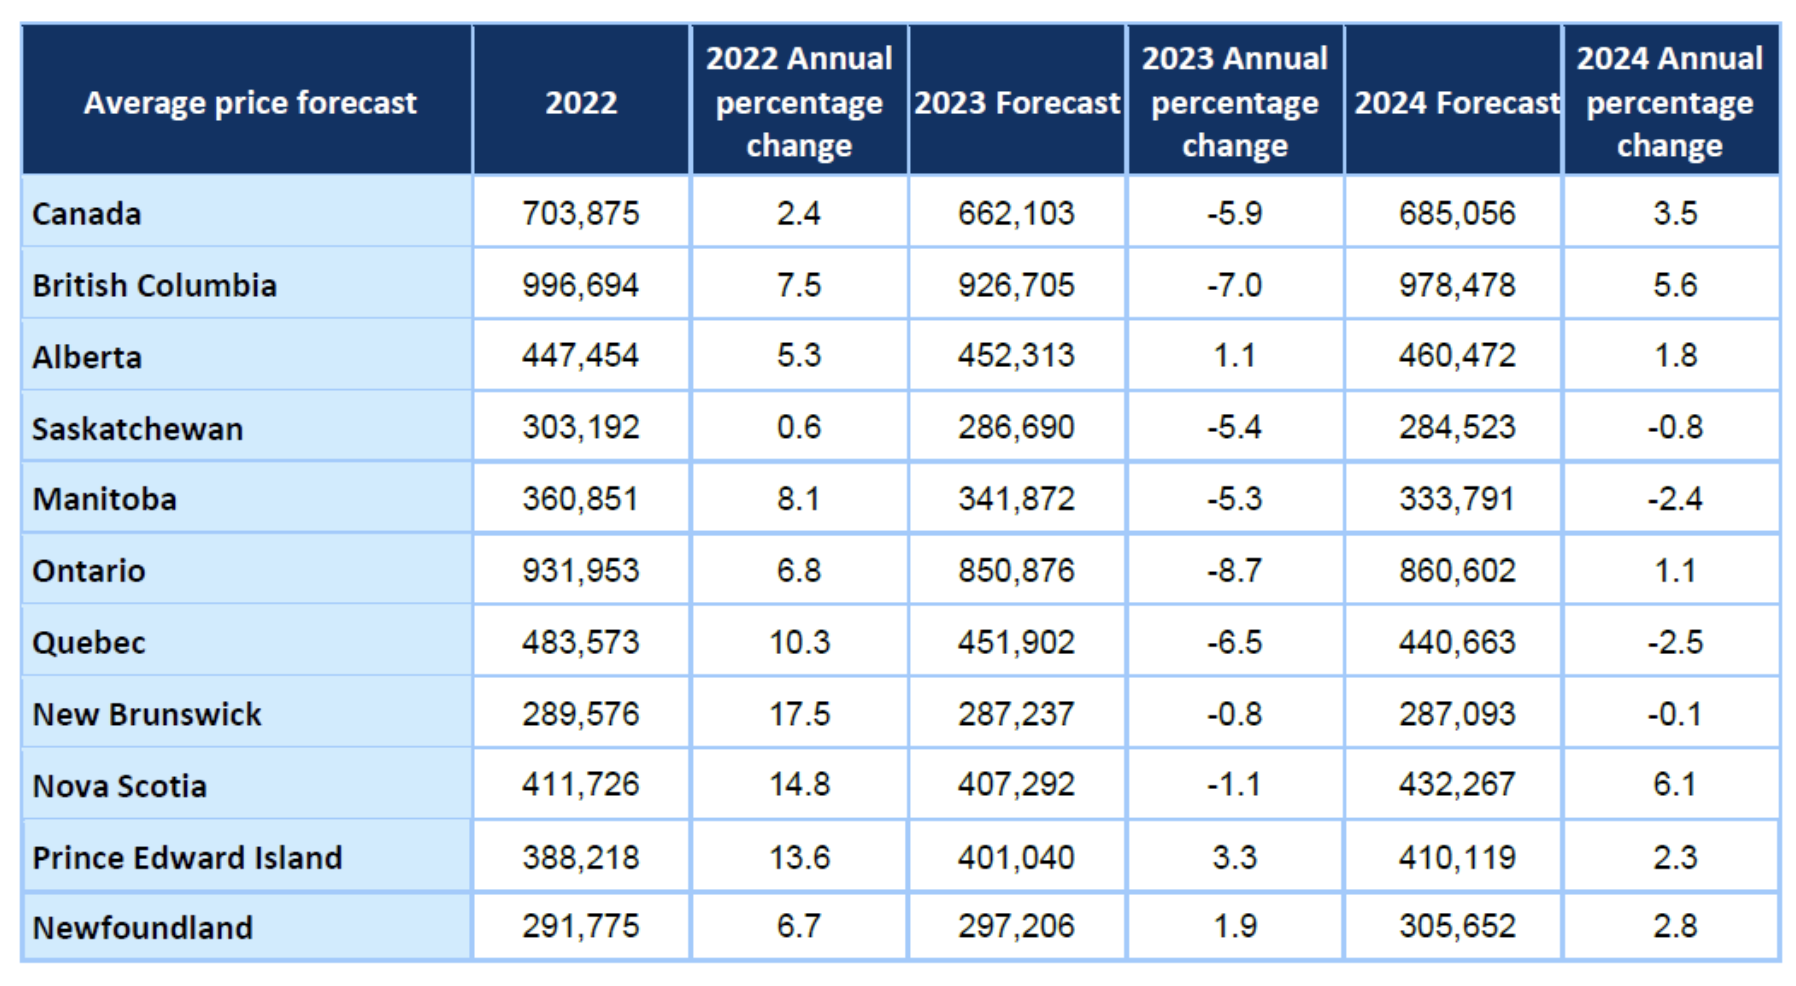
Market Prices Sold and Changes